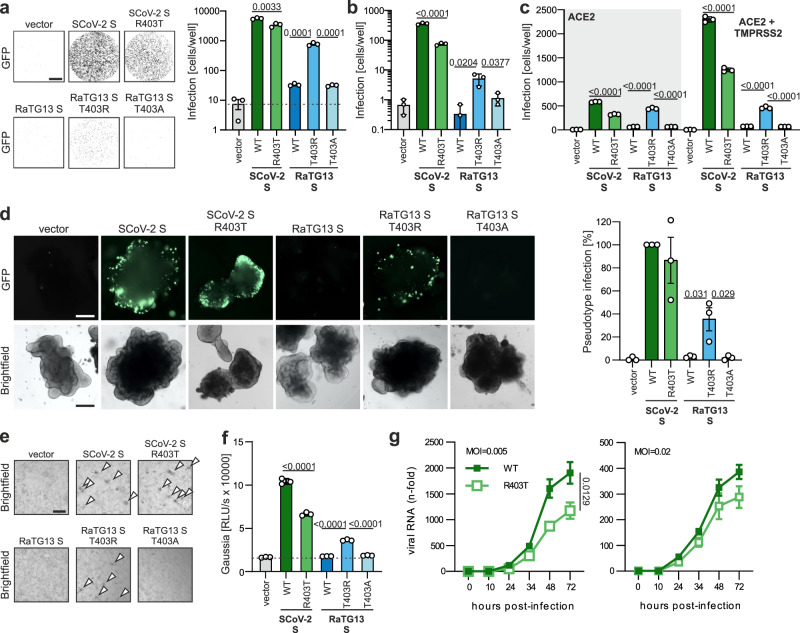
Fig. 2. R403 in Spike is crucial for ACE2-dependent entry.
a Binary images of CaCo-2 cells transduced with VSVΔG-GFP pseudotyped with SARS-CoV-2, RaTG13 or indicated mutant S. Successful infection events (=GFP positive cells) displayed as black dots. Scale bar, 1.5 mm and automatic quantification of infection events by counting GFP positive cells. Bars represent the mean of three independent experiments (±SEM); b automatic quantification of infection events of Calu-3 cells transduced with VSVΔG-GFP pseudotyped with SARS-CoV-2, RaTG13 or indicated mutant S. Bars represent the mean of three independent experiments (±SEM). c Automatic quantification of infection events of A459 ACE2 and A459 ACE2 and TMPRSS2 expressing cells transduced with VSVΔG-GFP pseudotyped with SARS-CoV-2, RaTG13 or indicated mutant S. Bars represent the mean of three independent experiments (±SEM). d Bright field and fluorescence microscopy (GFP) images of hPSC derived gut organoids infected with VSVΔG-GFP (green) pseudotyped with SARS-CoV-2, RaTG13, or indicated mutant S (300 µl, 2 h). Scale bar, 250 μm and quantification of the percentage of GFP-positive cells of (a). Bars represent the mean of three independent experiments (±SEM). e Bright field and fluorescence microscopy (GFP) images of HEK293T cells transfected with SCoV-2ΔS bacmid, SCoV2-N, ACE2, T7 polymerase and indicated Spike variants. Scale bar, 125 μm. Arrows indicate syncytia. f Quantification of Gaussia luciferase activity in the supernatant of HEK293T cells expressing SCoV-2ΔS-Gaussia bacmids as described in (c). Bars represent the mean of three independent experiments (±SEM). g Replication kinetic of Caco-2 cells, infected with either SARS-CoV-2 d6-YFP wild type or SARS-CoV-2 d6-YFP R403T (MOI 0.005 or 0.02). Supernatants were collected at the indicated time points post-infection, and replication was determined by RT-qPCR. Lines represent the mean of three independent experiments (±SEM). a−d, f Two-tailed Student’s t-test with Welch’s correction. g Two-tailed Student’s t-test with Welch’s correction (on area under the curve).

