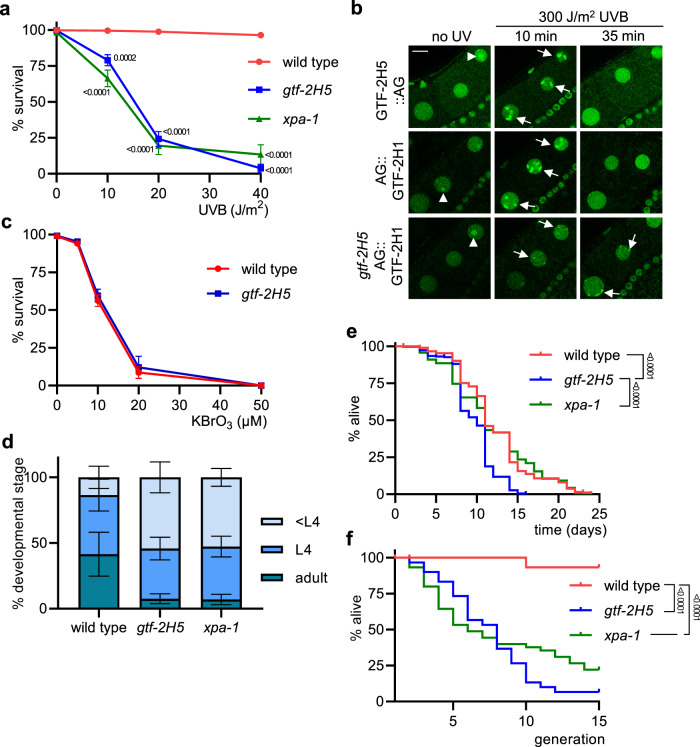
Fig. 4. gtf-2H5 animals are NER deficient and show diminished growth and lifespan.
a Germ cell and embryo survival assay after UVB irradiation of germ cells in young adult wild type, gtf-2H5 and xpa-1 animals. The percentages of hatched eggs (survival) after UVB irradiation are plotted against the applied UV-B doses. Results are plotted as average with SEM (error bars) of at least seven experiments. Number of animals counted, respectively for UV dose 0, 10, 20, 30 and 40 J/m2, for wild type n = 735, 820, 832 and 738; for gtf-2H5 n = 725, 495, 314 and 117; for xpa-1 n = 480, 284, 156 and 83. p values indicating statistical significant difference compared to wild type are shown. b Representative images showing real-time recruitment of GTF-2H5::AG or AG::GTF-2H1 to UVB-damaged chromosomes in oocytes of living wild type (upper and middle panel) or gtf-2H5 (lower panel) animals, before UVB irradiation (no UV) and 10 min and 35 min after 300 J/m2 UVB irradiation. Recruitment to paired homologous chromosomes are indicated with arrows. Nucleoli are indicated with an arrowhead. Scale bar: 10 µm. c Survival assay after incubation of wild type and gtf-2H5 L1/L2 larvae with increasing concentrations of KBrO3 for 24 h, which induces oxidative DNA damage. The percentages of non-arrested, developing larvae (survival) are plotted against the applied KBrO3 concentration. Results are plotted as average with SEM (error bars) of two independent experiments each performed in triplicate. Number of animals counted, respectively for KBrO3 dose 0, 5, 10, 20, and 50 µM, for wild type n = 637, 756, 707, 558 and 456; for gtf-2H5 n = 708, 688, 894, 505 and 467. d Quantification of larval growth of wild type, gtf-2H5 and xpa-1 animals by determining the percentage of adult, L4 and younger than L4 (<L4) animals observed 48 h after animals are laid as eggs at 25 °C. Results are plotted as average with SEM (error bars) of at least four independent experiments. Number of animals counted are for wild type n = 905, for gtf-2H5 n = 846 and for xpa-1 n = 456. e Post-mitotic lifespan analysis showing the percentage of alive adult wild type (n = 290), gtf-2H5 (n = 300) and xpa-1 (n = 285) animals per day. p values indicating statistical significance are shown. f Replicative lifespan analysis showing the percentage survival of successive generations of wild type, gtf-2H5 and xpa-1 animals if, in each generation, one animal is passaged. Depicted are cumulative results from at least two independent experiments (n = 15 per experiment). p values indicating statistical significance are shown. Numerical data are provided in Supplementary Data 2.

