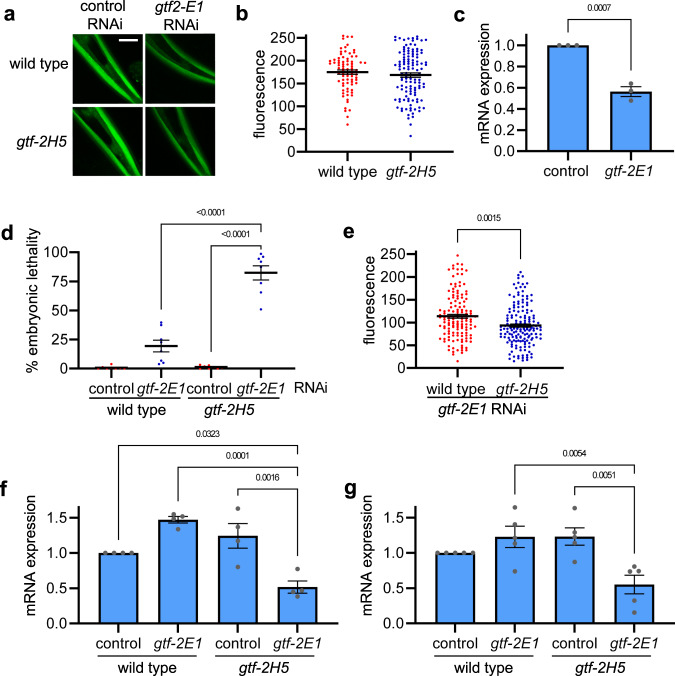
Fig. 5. GTF-2H5 promotes transcription when this is challenged.
a Representative images of wild type and gtf-2H5 animals expressing AID::GFP under control of eft-3 promoter in body wall muscles, shown here in the head of C. elegans, grown on control or gtf-2E1 RNAi. Scale bar: 25 µm. b Scatter dot plot showing average and SEM of the relative GFP fluorescence levels in head muscle cells of wild-type and gtf-2H5 animals, as depicted in a. c Relative gtf-2E1 mRNA levels as determined by qPCR on animals grown on control or gtf-2E1 RNAi. Results are normalized to control RNAi and plotted as average with SEM (error bars) of three independent experiments. d Scatter dot plot showing the average percentage with SEM of embryonic lethality observed on eight plates in two independent experiments with either wild type animals or gtf-2H5 animals (both also carrying the eft-3::GFP transgene used in a and b, grown on control or gtf-2E1 RNAi food. Number of animals counted for wild type are n = 617 (control RNAi), n = 570 (gtf-2E1 RNAi) and for gtf-2H5 n = 597 (control RNAi), n = 419 (gtf-2E1 RNAi). e Scatter dot plot showing average and SEM of the relative GFP fluorescence levels in head muscle cells of wild-type and gtf-2H5 animals grown on gtf-2E1 RNAi food, as depicted in a. f Relative cdc-42 mRNA levels as determined by qPCR on wild type or gtf-2H5 animals grown on control or gtf-2E1 RNAi. Results are normalized to wild type on control RNAi and plotted as average with SEM (error bars) of four independent experiments. g Relative pmp-3 mRNA levels as determined by qPCR on wild type or gtf-2H5 animals grown on control or gtf-2E1 RNAi. Results are normalized to wild type on control RNAi and plotted as average with SEM (error bars) of five independent experiments. p values indicating statistical significance are shown. Numerical data are provided in Supplementary Data 2.

