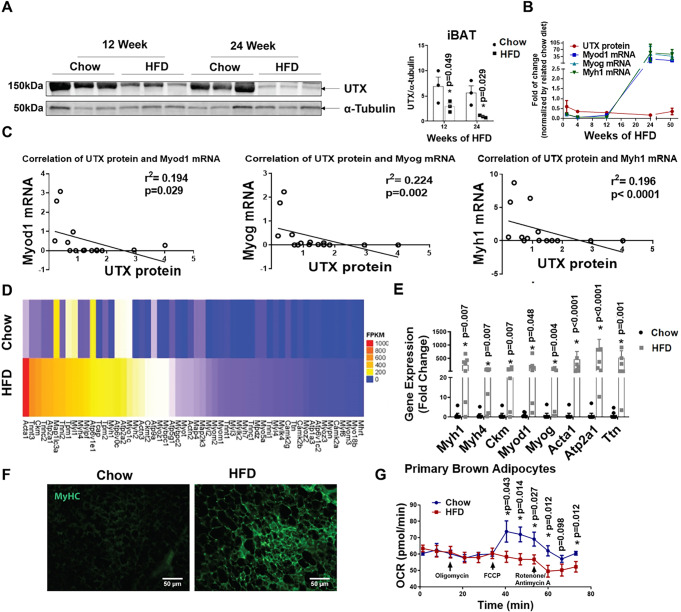
Fig. 3. Long-term HFD feeding induces BAT-to-myocyte remodeling in iBAT.
A UTX protein level in iBAT of C57BL/6 J mice fed with HFD for 12 and 24 weeks (n = 3/group). *indicates statistical significance between chow and HFD by two-tailed unpaired Student’s t-test. B Analysis of UTX protein levels and myogenic marker gene expression patterns in iBAT of HFD-fed mice for 1 week, 4 weeks, 12 weeks, 24 weeks, and 1 year. For UTX protein, n = 3/group. For Myod1, Myog, and Myh1 gene expression, n = 8/group. C Negative correlations between UTX protein levels and myogenic marker gene expression in iBAT of mice fed HFD for 1 week, 4 weeks, 12 weeks, 24 weeks, and 52 weeks (n = 15/group) as analyzed by Spearman’s rank correlation coefficient test, p = 0.029 between UTX protein and Myod1 mRNA, p = 0.002 between UTX protein and Myog mRNA, and p < 0.0001 between UTX protein and Myh1 mRNA. D Heatmap of myogenic marker gene expression from iBAT of wild-type mice fed chow or HFD. E Quantitative RT-PCR analysis of myogenic marker gene expression in iBAT of chow- or HFD-fed wild-type C57BL/6J mice (n = 7/group). *Indicates statistical significance between Chow and HFD by Mann–Whitney’s nonparametric U test. F Representative IHC staining of MyHC in iBAT of chow- or HFD-fed wild-type C57BL/6J mice (n = 3 replicates for each group). G OCR of primary brown adipocytes isolated from chow- or HFD-fed wild-type C57BL/6J mice (n = 24 for chow, n = 19 for HFD). *Indicates statistical significance between chow and HFD by two-tailed unpaired Student’s t-test. All data are expressed as mean ± SEM.

