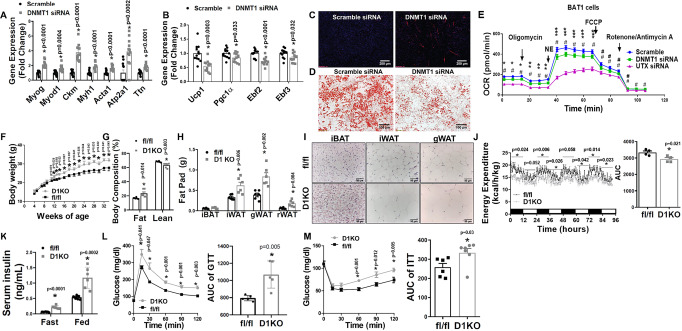
Fig. 5. DNMT1 deficiency in brown fat impairs brown fat function.
A, B Quantitative RT-PCR analysis of myogenic gene expression (A, n = 12/group) and BAT-specific gene expression (B, n = 12/group) in BAT1 brown adipocytes transfected with scramble or Dnmt1 siRNA. *Indicates statistical significance between Scramble and DNMT1 siRNA groups by two-tailed unpaired Student’s t-test. C, D Representative IHC staining of MyHC (C) and Oil red O staining (D) in BAT1 brown adipocytes transfected with scramble or Dnmt1 siRNA (n = 3 replicates for each group). E OCR in BAT1 brown adipocytes transfected with scramble, Dnmt1 or Utx siRNA measured by a Seahorse analyzer. n = 24 for Scramble, 31 for DNMT siRNA, and 24 for UTX siRNA; statistical significance was analyzed by one-way ANOVA with repeated measure followed by Fisher’s Least Significant Difference (LSD) test, F (2, 76) = 35.433, p < 0.0001. *p < 0.01, **p < 0.0001, ***p < 0.05 between Scramble and DNMT1 siRNA; #p < 0.0001, ##p < 0.01 between Scramble and UTX siRNA. For (A–E), BAT1 cells were differentiated into brown adipocytes as described under Methods and scramble and targeting siRNAs were transfected into day 4 differentiated BAT1 cells using Amaxa Nucleofector II Electroporator with an Amaxa cell line nucleofector kit L according to the manufacturer’s instructions (Lonza). Cells were harvested 2 days after for further analysis. F–H Body weight growth curve (F, n = 8 for fl/fl and 6 for D1KO), Body composition (G, n = 6/group), and Fat pad weight (H, n = 6/group) in female D1KO and fl/fl mice on chow diet. Female D1KO and fl/fl mice were weaned onto regular chow diet and various metabolic phenotypes were studied. *Indicates statistical significance between fl/fl and D1KO by two-tailed unpaired Student’s t-test. I Representative H&E staining of iWAT, iBAT and gWAT of female D1KO and flf/fl mice on chow diet (n = 4 replicates per group). J Energy expenditure in female D1KO and fl/fl mice on chow diet (n = 4/group). Left, *indicates statistical significance between fl/fl and D1KO analyzed by ANOVA with repeated measures: time 0–12 h, F(1,6) = 8.962, p = 0.024; time 12–24 h, F(1,6) = 5.819, p = 0.052; time 24–36 h, F(1,6) = 16.794, p = 0.006; time 36–48 h, F(1,6) = 8.664, p = 0.026; time 48–60 h, F(1,6) = 5.457, p = 0.058; time 60–72 h, F(1,6) = 6.637, p = 0.042; time 72–84 h, F(1,6) = 11.648, p = 0.014; time 84–96 h, F(1,6) = 9.294, p = 0.023. Right, *indicates statistical significance between fl/fl and D1KO by two-tailed unpaired Student’s t-test. K–M Fasting and fed serum insulin levels (K, n = 8 for fl/fl and 6 for D1KO), GTT (L, n = 5/group), and ITT (M, n = 6 for fl/fl and 7 for D1KO) of female D1KO and fl/fl mice on chow diet. *Indicates statistical significance between fl/fl and D1KO by two-tailed unpaired Student’s t-test. All data are expressed as mean ± SEM.

