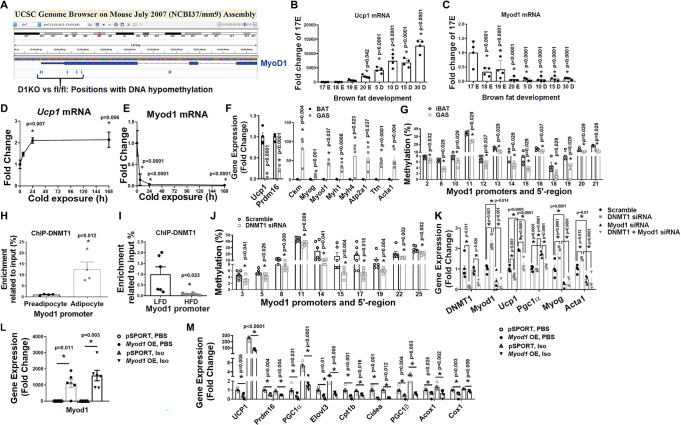
Fig. 7. MyoD1 mediates the effect of DNMT1 deficiency on brown fat myogenesis.
A RRBS profiling of DNA methylation level at MyoD1 promoter in iBAT of D1KO and fl/fl mice. B, C Ucp1 (B, n = 4/group) and Myod1 (C, n = 4/group) expression in iBAT of mice during late embryonic and postnatal development. *Indicates statistical significance vs. 17E with one-way ANOVA followed by Fisher’s LSD multiple comparisons test; in (B), F(7,24) = 48.31, p < 0.0001, and in (C), F(7,24) = 10.54, p < 0.0001. D, E Ucp1 (D) and Myod1 (E) expression in iBAT of mice during cold exposure (n = 3/group). *indicates statistical significance vs. Time 0 with one-way ANOVA followed by Fisher’s LSD multiple comparisons test; in (D), F(3,8) = 6.406, p = 0.016, and in (E), F(3,8) = 25.096, p < 0.0001. F Ucp1, Prdm16 and myogenic marker gene expression in iBAT and gastrocnemius (GAS) muscle (n = 4/group). *Indicates statistical significance between iBAT and GAS as analyzed by two-tailed unpaired Student’s t-test, except for Myod1 and Atp2a1, which were analyzed by Mann–Whitney’s nonparametric U test. G Pyrosequencing analysis of DNA methylation level at Myod1 promoter in iBAT and GAS muscle (n = 4/group). *Indicates statistical significance between iBAT and GAS as analyzed by Mann–Whitney’s nonparametric U test. H ChIP assay of DNMT1 binding to Myod1 promoter in undifferentiated BAT1 preadipocytes and differentiated BAT1 brown adipocytes (n = 4/group). *indicates statistical significance by two-tailed unpaired Student’s t-test. I ChIP assay of DNMT1 binding to Myod1 promoter in iBAT from HFD- or LFD-fed mice (n = 6/group). *Indicates statistical significance by two-tailed unpaired Student’s t-test. J Pyrosequencing analysis of DNA methylation levels at Myod1 promoter in BAT1 brown adipocytes transfected with scramble or Dnmt1 siRNA (n = 6/group). *Indicates statistical significance between iBAT and GAS as analyzed by Mann–Whitney’s nonparametric U test. K Quantitative RT-PCR analysis of myogenic marker gene and BAT gene expression in BAT1 brown adipocytes transfected with scramble, Dnmt1, Myod1, or Dnmt1 + Myod1 siRNA (n = 4/group). *Indicates statistical significance among groups. For Dnmt1 and Myod1, statistical significance was analyzed by Kruskal–Wallis non-parametric ANOVA H test by rank followed by Pairwise Comparisons test between groups, H(3) = 13.560, p = 0.004 for Dnmt1, and H(3) = 13.097, p = 0.004 for Myod1. For Ucp1, Pgc1α, Myog and Acta1, statistical significance was analyzed by one-way ANOVA followed by Fisher’s LSD multiple comparisons test: for Ucp1, F(3,12) = 45.139, p < 0.0001; for Pgc1α, F(3,12) = 51.81, p < 0.0001; for Myog, F(3,12) = 33.178, p < 0.0001; for Acta1, F(3,12) = 20.045, p < 0.0001. L, M Myod1 (L) and BAT-specific gene expression (M) in Myod1-overexpressed BAT1 brown adipocytes treated with PBS or isoproterenol (Iso). n = 6/group. *indicates statistical significance analyzed by Kruskal–Wallis non-parametric ANOVA H test by rank followed by Pairwise Comparisons test between groups. In (L), H(3) = 17.613, p = 0.001. In (M), for Ucp1, H(3) = 21.6, p < 0.0001; for Prdm16, H(3) = 17.553, p = 0.001; for Pgc1α, H(3) = 20.309, p < 0.0001; for Elovl3, H(3) = 19.62, p < 0.0001; for Cpt1b, H(3) = 18.033, p < 0.0001; for Cidea, H(3) = 18.023, p < 0.0001; for pgc1β, H(3) = 21.367, p < 0.0001; for Acox1, H(3) = 16.847, p = 0.001; for Cox1, H(3) = 19.807, p = 0.0009. For (J–M), BAT1 cells were differentiated into brown adipocytes as described under Methods. Scramble or targeting siRNAs, or control or Myod1 overexpressing plasmids were transfected into day 4 differentiated BAT1 cells using Amaxa Nucleofector II Electroporator with an Amaxa cell line nucleofector kit L. Cells were harvested 2 days after for pyrosequencing or gene expression analysis. All data are expressed as mean ± SEM.

