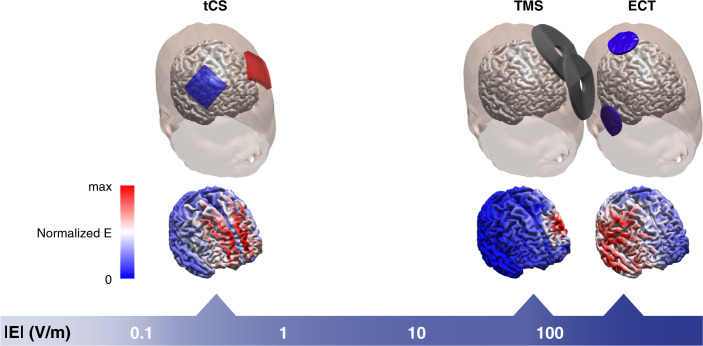
Fig. 2. Simulation models of bifrontal tCS, figure-8 coil TMS, and right unilateral ECT.
The E-field distributions are normalized to their respective maximum values to allow for contrast of the relative focality among stimulation modalities. The absolute E-field (logarithmic) scale indicates the approximate range of field strengths induced by tCS (~0.5 V/m), TMS (~100 V/m), and ECT (~200 V/m) at typically therapeutic doses.

