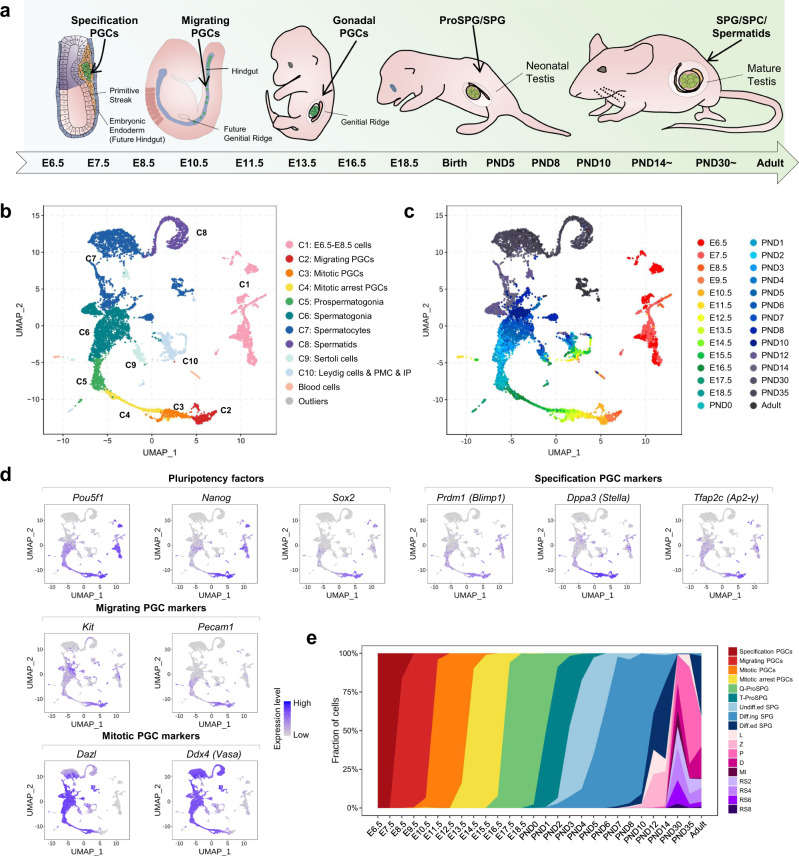
Fig. 1. A single-cell map of mouse male germ cell development.
a Schematic overview of the sampled time-points across mouse male germ cell development. b UMAP (Uniform Manifold Approximation and Projection) plot of the 11,598 mouse germ cells and somatic cells included in this study. Cells are colored by indicated cell types. c UMAP plot of 11,598 mouse germ cells and somatic cells included in this study. Cells are colored by indicated developmental time-points. d UMAP plots are colored by expression levels for selected marker genes. Aliases of some genes are also shown. The color key from gray to blue indicates low to high expression levels. e Proportion of germ cell types across the sampled time-points. L, leptotene; Z, zygotene; P, pachytene; D, diplotene; MI, metaphase I; RS, round spermatids.

