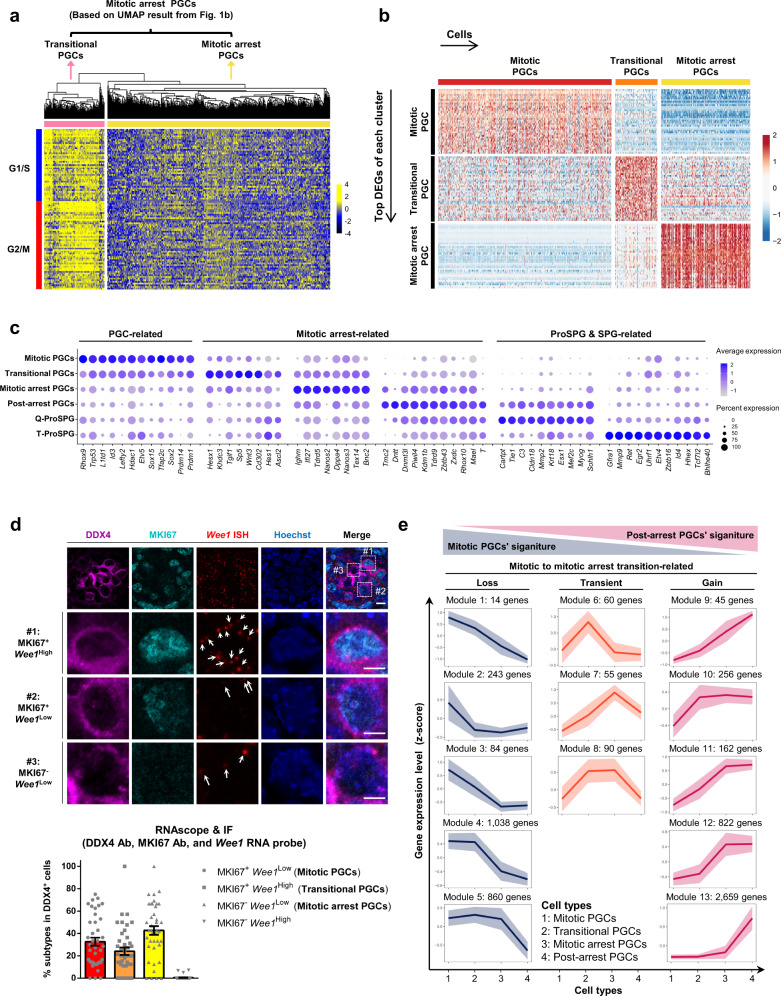
Fig. 3. Mitotic to mitotic arrest transition is companied by global transcriptome reconfiguration.
a Heatmap showing cell-cycle-related genes based hierarchical clustering result of the mitotic arrest PGCs identified from Fig. 1b. The transitional PGCs are clearly subdivided as an independent cell cluster. b Heatmap of the top DEGs of each stage (identified among the mitotic PGCs, transitional PGCs and mitotic arrest PGCs). The color key from blue to red indicates low to high expression levels. c Dotplot showing the expression patterns of gene sets in the mitotic PGCs, transitional PGCs, mitotic arrest PGCs, post-arrest PGCs, Q-ProSPG, and T-ProSPG. Dot size indicates the fraction of cells with detectable expression for a given marker gene and the color key indicates average gene-expression levels in each cell type. d RNAscope of Wee1 co-stained with immunofluorescence of DDX4 and MKI67 antibodies in E14.5 mouse male gonadal sections. Arrows indicate the dots of the probe signals, each representing one copy of the Wee1 mRNA. Scale bar, 10 μm. Detailed images of the indicated germ cells are also shown. Scale bar, 5 μm. Images are obtained using ZEISS LSM880 confocal microscope under a C-Apochromat 63×/1.20 W korr M27 objective lens with 2× scan zoom. Relative proportions of mitotic- (MKI67+ Wee1Low), transitional- (MKI67+ Wee1High), and mitotic arrest PGCs (MKI67− Wee1Low) in the WT mouse male gonads at E14.5 are also shown below. Mean ± SEM, n = 457 cells examined over four biologically independent experiments. e Clustering analysis of dynamic gene expression during mitotic to mitotic arrest transition. Thirteen modules of genes form three distinct categories according to the expression patterns. Gene number per cluster was followed by the module number. Mean of scaled gene-expression level of each module (solid line) was shown with 95% confidence interval (shadow).

