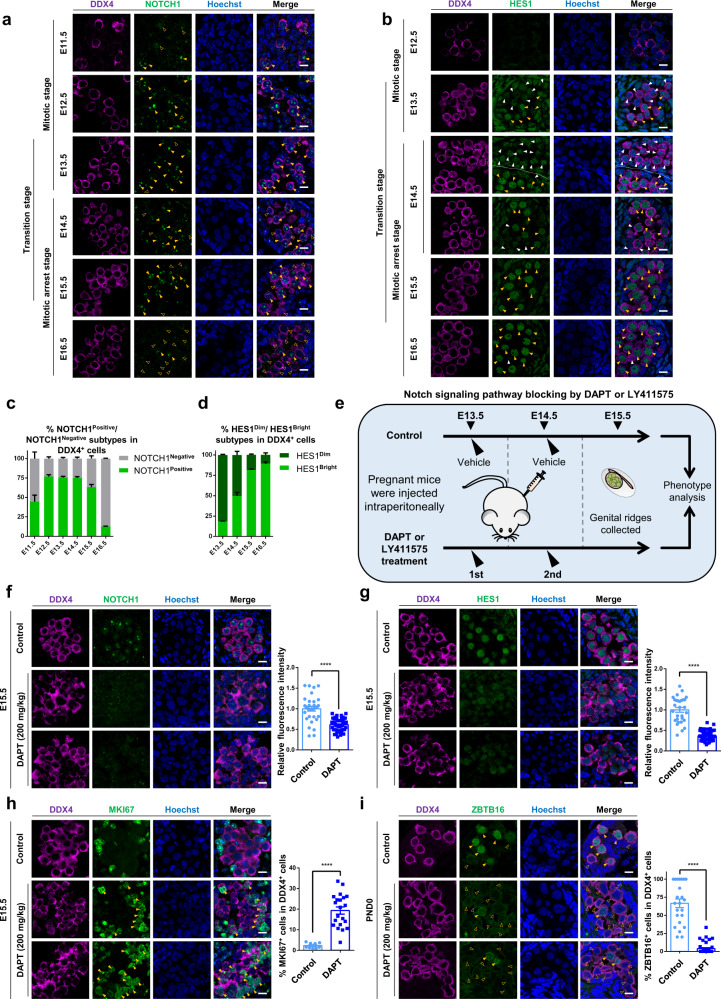
Fig. 4. Notch signaling pathway regulates the mitotic arrest of male PGCs.
a Immunofluorescence of NOTCH1 co-stained with DDX4 in E11.5–E16.5 mouse male gonads. Hollow and solid yellow arrowheads indicate NOTCH1Negative and NOTCH1Positive subtypes in DDX4+ cells, respectively. Scale bar, 10 μm. b Immunofluorescence of HES1 co-stained with DDX4 in E11.5–E16.5 mouse male gonads. White and yellow arrowheads indicate HES1Dim and HES1Bright subtypes in DDX4+ cells, respectively. Scale bar, 10 μm. c Proportion of NOTCH1Negative and NOTCH1Positive subtypes in DDX4+ cells in E11.5–E16.5 mouse male gonads. Mean ± SEM, n = at least 2 biologically independent samples for each time-point. d Proportion of HES1Dim and HES1Bright subtypes in DDX4+ cells in E11.5–E16.5 mouse male gonads. Mean ± SEM, n = at least three biologically independent samples for each time-point. e Schematic showing the workflow of treatment of γ-Secretase inhibitor–DAPT or LY411575 for Notch signaling pathway blocking. f Immunofluorescence of NOTCH1 co-stained with DDX4 and the quantification of relative fluorescence intensity in DAPT-treatment and control mouse male gonads at E15.5. Scale bar, 10 μm. Mean ± SEM, n = 3 per group, **** P < 0.0001, P = 9.5E–13, unpaired two-tailed t test. g Immunofluorescence of HES1 co-stained with DDX4 and the quantification of relative fluorescence intensity in DAPT-treatment and control mouse male gonads at E15.5. Scale bar, 10 μm. Mean ± SEM, n = 3 per group, **** P < 0.0001, P = 4.0E–25, unpaired two-tailed t test. h Immunofluorescence of MKI67 co-stained with DDX4 and proportion of MKI67+ cells in DDX4+ cells in DAPT-treatment and control mouse male gonads at E15.5. Solid yellow arrowheads indicate MKI67Positive subtypes in DDX4+ cells. Scale bar, 10 μm. Mean ± SEM, n = 3 per group, **** P < 0.0001, P = 8.8E–07, unpaired two-tailed t test. i Immunofluorescence of ProSPG and SPG marker ZBTB16 co-stained with DDX4 and proportion of ZBTB16+ cells in DDX4+ cells in DAPT-treatment and control mouse male gonads at PND0. Hollow and solid yellow arrowheads indicate ZBTB16Negative and ZBTB16Positive subtypes in DDX4+ cells, respectively. Scale bar, 10 μm. Mean ± SEM, n = 3 per group, **** P < 0.0001, P = 1.2E–18, unpaired two-tailed t test.

