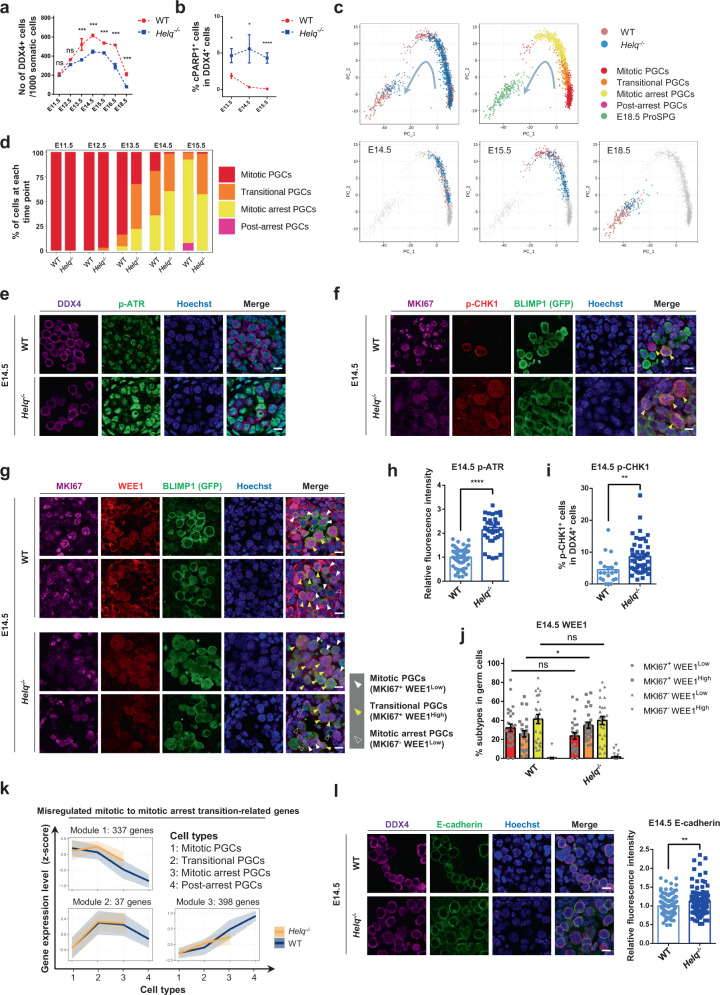
Fig. 5. Proper mitotic to mitotic arrest transition is crucial for the prenatal development of male germ cells.
a Numbers of DDX4+ cells from E11.5 to E16.5, and E18.5 WT versus Helq−/− mouse male gonads. Mean ± SEM, n = 4 per time-point, ns, not significant, *** P < 0.001, E11.5 (P = 0.5731), E12.5 (P = 0.0706), E13.5 (P = 0.0004), E14.5 (P = 0.0001), E15.5 (P = 0.0004, E16.5 (P = 0.0002), E18.5 (P = 0.0002), unpaired two-tailed t test. b Scatter diagram showing the proportions of cPARP1+ cells in DDX4+ cells from E13.5 to E15.5 in the WT- and Helq−/− mouse male gonads. Mean ± SEM, n = at least 2 per time-point, * P < 0.05, **** P < 0.0001, E13.5 (P = 0.0176), E14.5 (P = 0.0358), E15.5 (P = 7.7E−05), unpaired two-tailed t test. c PCA (Principal component analysis) plots showing the developmental trajectory of 985 WT- and 724 Helq−/− mouse male germ cells sampled between E14.5 and E18.5. The same PCA is also plotted, highlighting only cells from each stage (cell numbers: n = 187, WT; n = 191, Helq−/− for E14.5; n = 185, WT; n = 187, Helq−/− for E15.5; n = 140, WT; n = 72, Helq−/− for E18.5, also see Supplementary Fig. 8a). d Relative proportions of mitotic-, transitional-, mitotic arrest-, and post-arrest PGCs from E11.5 to E15.5 in the WT- versus Helq−/− mouse male gonads. e Immunofluorescence of p-ATR co-stained with DDX4. Scale bar, 10 μm. f Immunofluorescence of p-CHK1 co-stained with MKI67 and BLIMP1 (GFP) in the WT- and Helq−/− mouse male gonads at E14.5. Arrowheads indicate p-CHK1+ subtypes in MKI67+ germ cells. Scale bar, 10 μm. g Immunofluorescence of WEE1 co-stained with MKI67 and BLIMP1 (GFP) in the WT- and Helq−/− mouse male gonads at E14.5. Scale bar, 10 μm. h The quantification of relative fluorescence intensity of p-ATR in the WT- and Helq−/− mouse male germ cells at E14.5. Mean ± SEM, n = 4 per group, **** P < 0.0001, P = 9.1E–19, unpaired two-tailed t test. i Relative proportions of of p-CHK1+ germ cells in the WT- and Helq−/− mouse male germ cells at E14.5. Mean ± SEM, n = 4 per group, ** P < 0.01, P = 0.0029, unpaired two-tailed t test. j Relative proportions of mitotic- (MKI67+ WEE1Low), transitional- (MKI67+ WEE1High), and mitotic arrest PGCs (MKI67− WEE1Low) in the WT- versus Helq−/− mouse male gonads at E14.5. Mean ± SEM, n = 4 per group, ns, not significant, * P < 0.05, MKI67+ WEE1Low (P = 0.1113), MKI67+ WEE1High (P = 0.0488), MKI67− WEE1Low (P = 0.8135), unpaired two−tailed t test. k Clustering analysis of the misexpression of mitotic to mitotic arrest transition-related genes expression. Three distinct modules according to the expression patterns were shown. Misregulated gene number per cluster was followed by the module number. Mean of scaled gene-expression level of each module (solid line) was shown with 95% confidence interval (shadow). l Immunofluorescence of E-cadherin co-stained with DDX4 and the quantification of relative fluorescence intensity in the WT- and Helq−/− mouse male gonads at E14.5. Scale bar, 10 μm. Mean ± SEM, n = 4 per group, ** P < 0.01, P = 0.0029, unpaired two-tailed t test.

