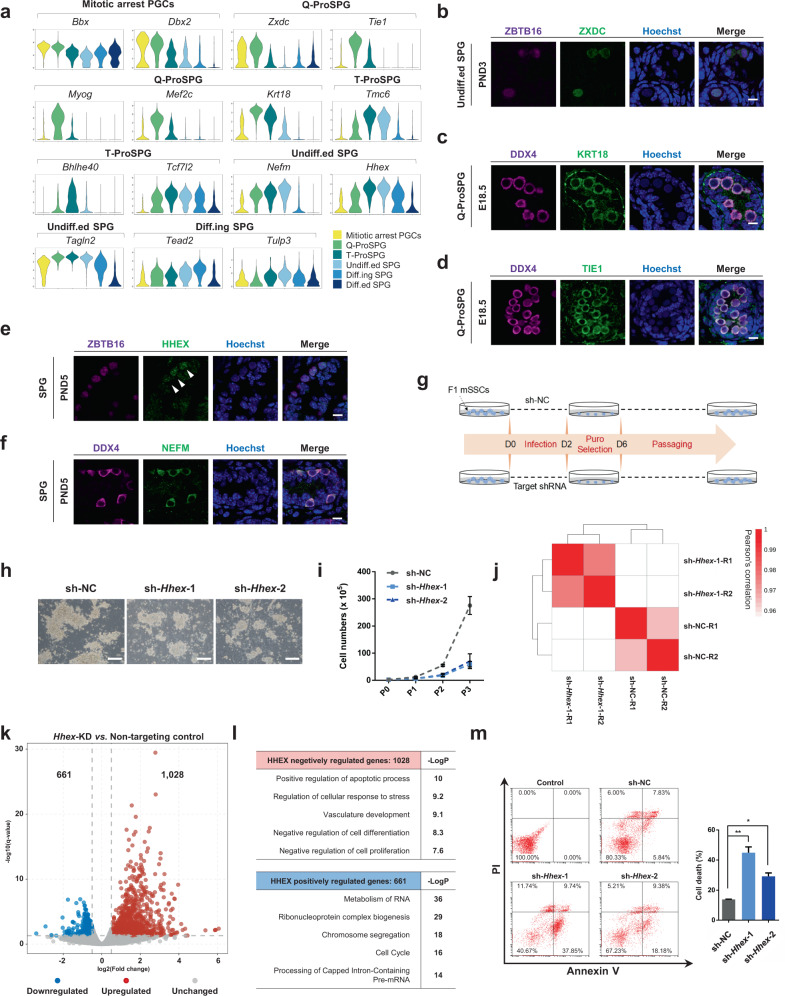
Fig. 6. Formation of the spermatogonial stem cell pool.
a Violin plots showing the relative expression levels (log(TPM/10 + 1)) of the identified marker genes of mitotic arrest PGCs, ProSPG and SPG. b Immunofluorescence of ZXDC co-stained with ZBTB16 in PND3 mouse testis. Scale bar, 10 μm. c Immunofluorescence of KRT18 co-stained with DDX4 in E18.5 mouse testis. Scale bar, 10 μm. d Immunofluorescence of TIE1 co-stained with DDX4 in E18.5 mouse testis. Scale bar, 10 μm. e Immunofluorescence of HHEX co-stained with ZBTB16 in PND5 mouse testis. Scale bar, 10 μm. Arrowheads indicate the HHEX+ SPG. f Immunofluorescence of NEFM co-stained with DDX4 in PND5 mouse testis. Scale bar, 10 μm. g Schematic showing the workflow of gene knockdown in mSSCs. h Representative cell morphology of Hhex-knockdown mSSCs compared to control mSSCs transduced with non-targeting shRNA (shNC). Scale bar, 200 μm. i Proliferation of mSSCs upon Hhex knockdown. Data are shown as the mean ± SEM, n = at least 3 biologically independent samples for each group. j Heatmap showing the hierarchically clustered Pearson’s correlation coefficient among different samples based on global gene-expression profiling in bulk cell populations. k Volcano plots showing DEGs (performed by DESeq2 with likelihood ratio test) between the cells transfected with non-targeting shRNA or with shRNAs against Hhex. The number of DEGs (|log2(fold change)|) ≥ 0.5, q-value < 0.05) are shown above the plots. l Representative GO terms of DEGs in Hhex-knockdown mSSCs. m Cell death of Hhex-knockdown mSSCs. Quantitative data are shown as the mean ± SEM to the right, n = 2, * P < 0.05, ** P < 0.01, sh-NC vs. sh-Hhex-1 (P = 0.0074), sh-NC vs. sh-Hhex-2 (P = 0.0109), unpaired two-tailed t test.

