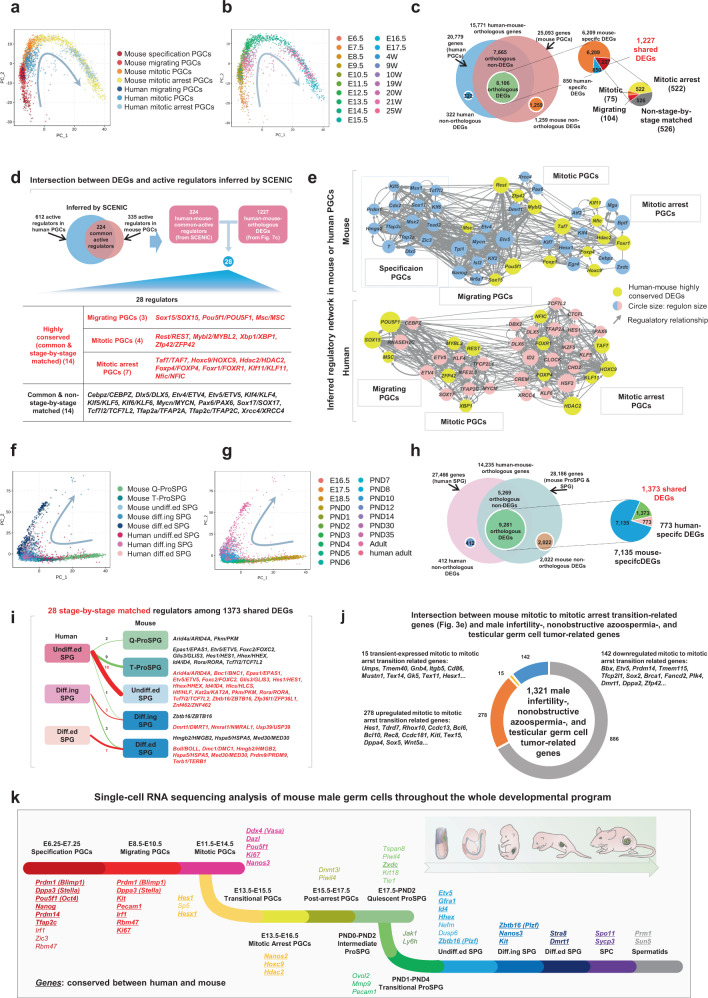
Fig. 7. Interspecies comparison of male germ cell development between human and mouse.
a PCA plots of four phases of mouse male PGCs and three phases of human male PGCs. Cells are colored based on the cell types are shown. b PCA plots of four phases of mouse male PGCs and three phases of human male PGCs. Cells are colored based on the sampled time-points shown. c Pie chart showing the distribution of human-mouse orthologous- and non-orthologous genes in the transcription profiles of mouse male PGCs and human male PGCs. The distribution of stage-by-stage matched and mismatched DEGs are also shown. d Intersection between DEGs and active regulators inferred by SCENIC in mouse male PGCs and human male PGCs. e Inferred regulatory networks of representative regulators in mouse male PGCs (Top) and human male PGCs (Bottom) are shown. Nodes labeled by yellow indicate the human-mouse highly conserved DEGs (common & stage-by-stage matched regulators). f PCA plots of five phases of mouse male ProSPG and SPG and three phases of adult human male SPG. Cells are colored based on the cell types are shown. g PCA plots of five phases of mouse male ProSPG and SPG and three phases of human adult male SPG. Cells are colored based on the sampled time-points. h Venn diagram showing the distribution of human-mouse orthologous- and non-orthologous genes in the transcription profiles of mouse male ProSPG and SPG and adult human male SPG. i 28 stage-by-stage matched regulators among 1,373 shared DEGs are shown. j Intersection between mouse mitotic to mitotic arrest transition-related genes (Fig. 3e) and male infertility-, nonobstructive azoospermia-, and testicular germ cell tumor-related genes. k The cell stages determined by scRNA-seq during mouse male germ cell development are shown in different colors. Genes conserved in humans and mice are bolded and underlined.

