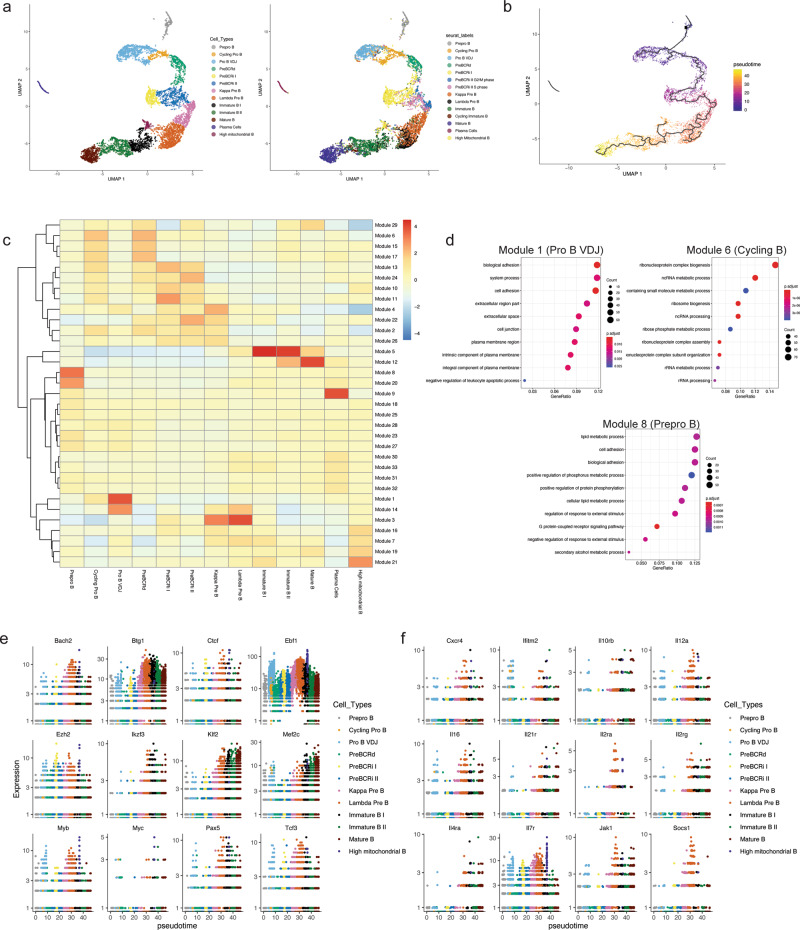
Fig. 6. Pseudotime analysis illustrates the kinetics of transcription-factor expression and gene modules that are differentially expressed across the B-cell development trajectory.
a Cell cycle-related genes were regressed within Monocle3 and UMAP dimension reduction was performed. Clustering was performed based on the Monocle3 clusters (left). Cells from Monocle-based clustering labeled with Seurat cluster labels (right). b Pseudotime values were calculated and plotted. c Module analysis to demonstrate gene modules that change across the B-cell developmental trajectory. A total of 33 modules and their expression intensity for each stage are shown. Color scale represents normalized module gene expression. d Gene ontology term analysis of selected modules 1, 6, and 8. e Expression of B-lymphoid transcription factors and epigenetic factors across B-cell development stages. f Expression of cytokine, chemokine and cytokine/chemokine receptors across the B-cell developmental trajectory.

