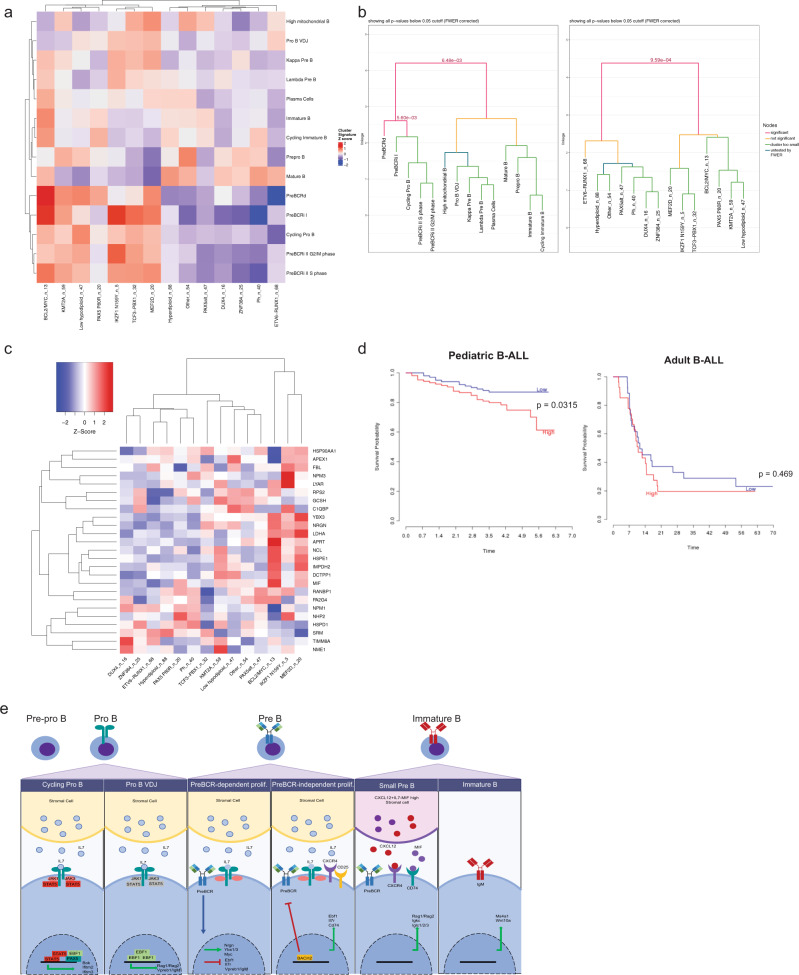
Fig. 7. B-cell developmental gene networks correlate with various B-ALL subtypes and associate with prognosis.
a Heatmap of cluster gene sets and various human B-ALL subtypes. n_number denotes the number of patient samples falling in each B-ALL subtype. Average z-score of cluster marker genes was calculated for each cluster and hierarchical clustering was performed for both B-ALL subtype and average cluster z-score. b Monte-Carlo-based statistical testing of the hierarchical clustering was performed for row (B-cell development stages) and column (human B-ALL subtypes). Significant p-values (<0.05) are shown and colored as a red line. c Overlapping differentially upregulated gene markers in the pre-BCR-dependent clusters from Seurat and Monocle are plotted (y axis). The expression of these genes was queried across various B-ALL subtypes (x axis). The number of B-ALL samples (n) is listed after each subtype. d Survival curve of pediatric B-ALL (left, time in years) and adult B-ALL (right, time in months). Low and high expression correspond to below-median and above-median expression of YBX3, respectively. Survival data were obtained from Prediction of Clinical Outcomes from Genomic Profiles (PRECOG)71 e Proposed model of B-cell development.

