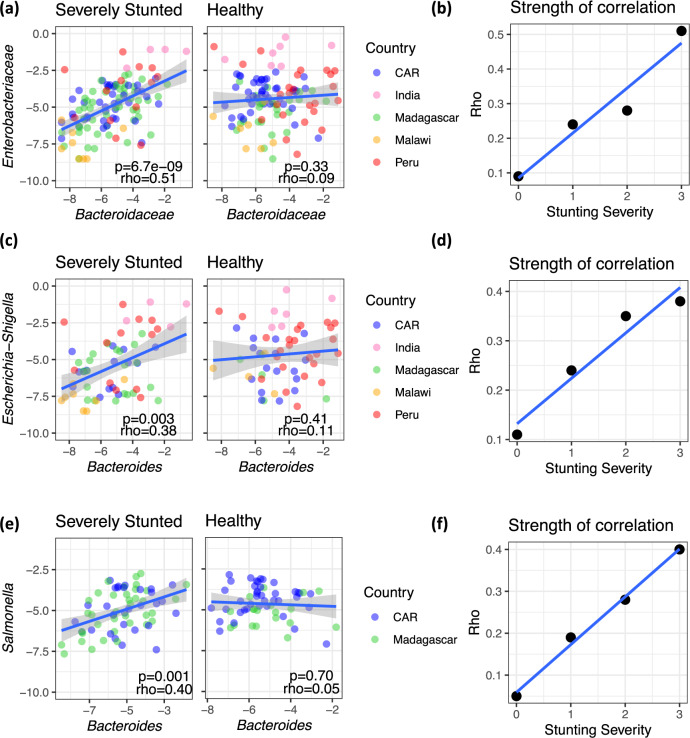
Fig. 5. Bacteroidaceae and Enterobacteriaceae are co-abundant in the fecal microbiota of undernourished children.
a Correlation between the log-transformed relative abundance of Bacteroidaceae and Enterobacteriaceae in severely stunted (n = 115) and healthy children (n = 110). b The coefficient of correlation (Spearman’s rho) as calculated between Bacteroidaceae and Enterobacteriaceae for each subset of stunting severity. c Correlation between the log-transformed relative abundance of Bacteroides and Escherichia–Shigella in severely stunted (n = 61) and healthy children (n = 56). d The coefficient of correlation (Spearman’s rho) as calculated between Bacteroides and Escherichia–Shigella for each subset of stunting severity. e Correlation between the log-adjusted relative abundance of Bacteroides and Salmonella in severely stunted (n = 67) and healthy children (n = 59). f The coefficient of correlation (Spearman’s rho) as calculated between Bacteroides and Salmonella for each subset of stunting severity. All panels report two-sided Spearman’s rho and P value and exclude children for which one or both taxa were absent. The blue lines in (a–f) are a linear fit and the shaded areas in (a, c, and e) represent 95% confidence interval. Stunting is defined as follows: 3, “severely stunted” (HAZ ≤ −3); 2, “moderately stunted” (−3>HAZ ≤ −2); 1, “at risk of stunting” (−2>HAZ ≤ −1), and 0, “healthy” (HAZ > −1).

