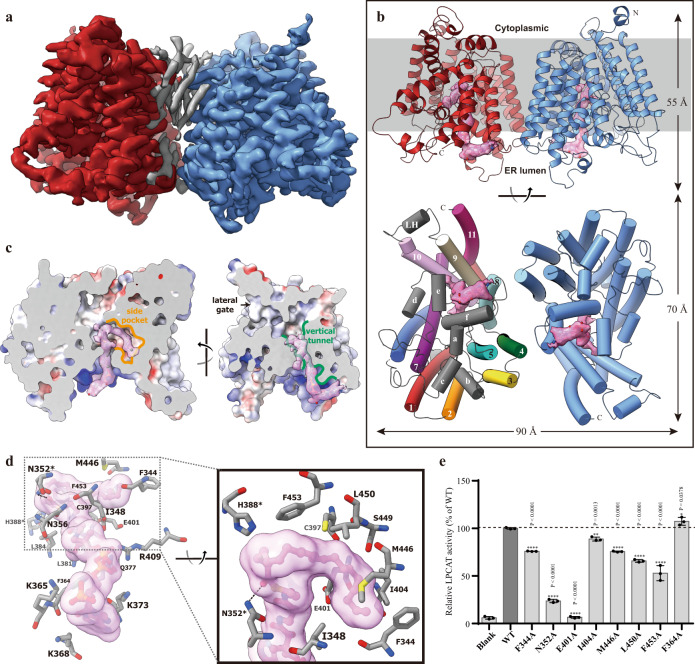
Fig. 2. The cryo-EM structure of cLPCAT3 bound with araCoA.
a cLPCAT3 cryo-EM map viewed from the lumen side of the ER membrane. The two protomers in dimeric cLPCAT3 were shown in red and blue, respectively. The non-protein electron density at the dimeric interface was shown in gray. b The cartoon representation of cLPCAT3/araCoA molecular model. The non-protein electron density in the vertical tunnel and side pocket was shown in the pink surface and the araCoA molecules that fit in the density were shown as a stick-and-ball model. Upper: the cLPCAT3 viewed parallel to the ER membrane. Lower: the cLPCAT3 viewed from the lumen side of the ER membrane. One of the promotors was colored to the same scheme as in Fig. 1c for clear observation. c The binding of the araCoA within the vertical tunnel and side pocket. The intersecting surfaces of the T-shape chamber of cLPCAT3 were shown parallel to the ER membrane at two angles. The vertical tunnel and side pocket were highlighted in green and yellow color, respectively. d The interaction of araCoA with residues in the vertical tunnel and side pocket. The catalytic residue N352 was marked with an asterisk. e The TLC assay results on the purified wild type cLPCAT3 (dark column) and araCoA-related mutants (gray columns). The enzymatic activities of mutants were normalized as the percentage of that of wild type cLPCAT3. The results were shown as mean ± s.d.; n = 3 independent experiments for all mutants. One-way ANOVA with Dunnett’s multiple comparisons test was applied and the 95% CI was calculated by Graphpad Prism (version 6.01), and p-values were labeled above the histogram.

