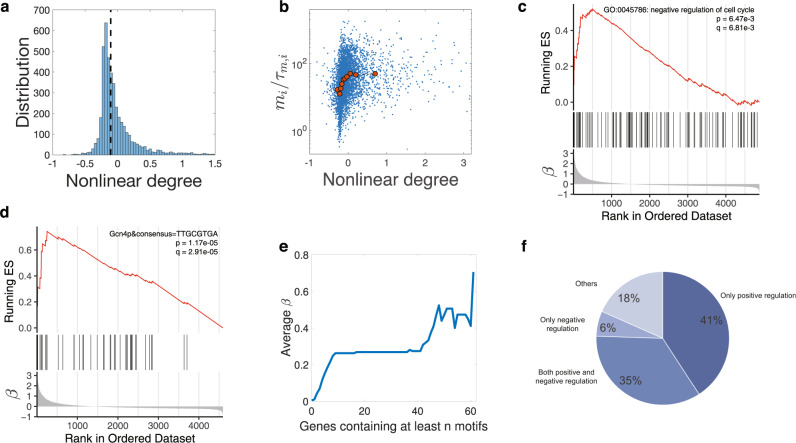
Fig. 4. Analysis of experimental data.
a Distribution of the nonlinear scaling degrees of mRNAs of S. cerevisiae among genes. The dashed line marks the location of the median value of the nonlinear degrees. We consider genes with − 1 < β < 3.2, including 95% of all the measured genes. b The Pearson correlation coefficient between the nonlinear degrees of mRNAs and the mRNA production rates is 0.17 (two-sided Pearson correlation test, p value < 2.20e-16). The red data points are median values after binning. For the same data, the Spearman correlation coefficient is 0.35 (Spearman correlation test, p value < 2.20e-16). c Genes annotated as negative regulation of cell cycle are enriched in the sublinear regime. In the bottom panel, genes are ordered by the nonlinear degree β from positive (sublinear) to negative (superlinear). In the middle panel, the vertical lines represent the locations of the cell-cycle inhibitors. The upper panel shows the running enrichment score (ES) for the gene set, where the score at the peak is the ES for this gene set. The top-right legend includes the p value and the FDR q value of GSEA. d An example of a motif that is enriched in the sublinear regime. Here, the vertical lines in the middle panel represent the locations of genes containing the particular motif in the promoter sequences. Note that the motif also appears in the weakly superlinear regime but diminishes in the strongly superlinear regime. e We pick out all 77 motifs enriched in the promoters of sublinear genes and calculate the average β over genes with at least n motifs. f The functions of transcription factors associated with the 77 motifs enriched in the sublinear regime. Positive regulation of transcription by RNA polymerase II (GO:0045944) is enriched with p value = 2.41e-32. The 76% positive regulation is not likely generated from random sampling (single-sided hypergeometric test, p value = 5.29e-4).

