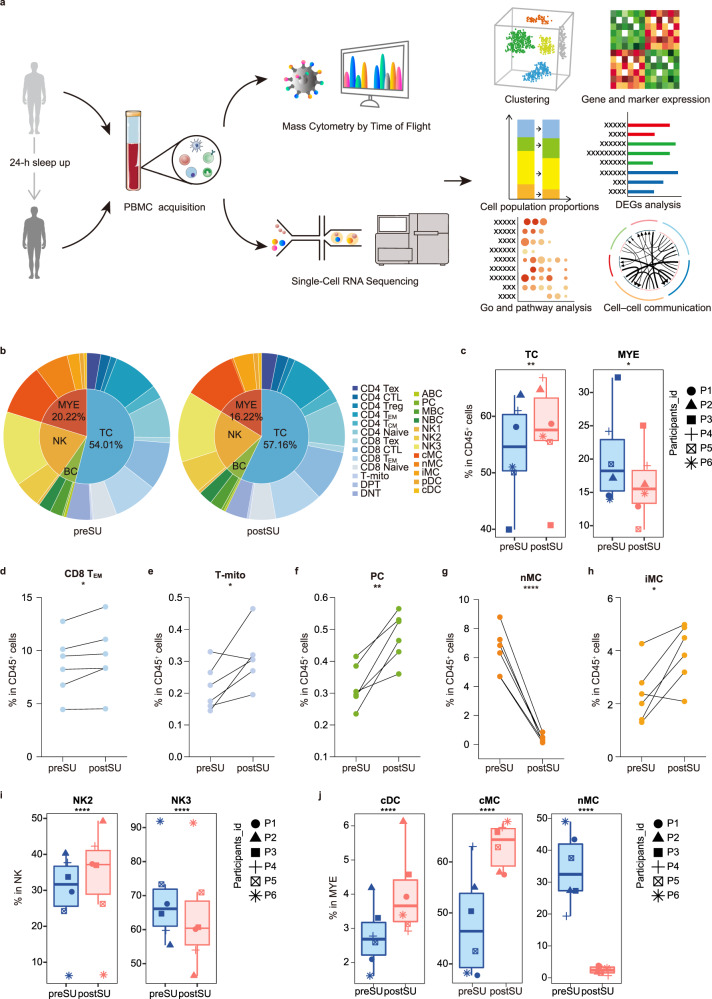
Fig. 1. The experimental design and changes in cell proportions after SU.
a Schematic of the experimental design for mass cytometry by time of flight (CyTOF) and single-cell RNA sequencing (scRNA-seq). Peripheral blood mononuclear cells (PBMCs) of six healthy individuals were collected before and post the 24-h sleep loss, then processed CyTOF and scRNA-seq for the subsequent studies. b Pie charts showing relative cluster abundance in the preSU and postSU groups. The percentage of TC and MYE (c), CD8 TEM (d), T-mito (e), PC (f), nMC (g) and iMC (h) in CD45+ immune cell between preSU and postSU groups (n = 6 /group). i The percentage of NK2 and NK3 subsets in NK between preSU and postSU groups (n = 6 /group). j The percentage of cMC, nMC and cDC in MYE between preSU and postSU groups (n = 6 /group). Significance in d–h was calculated using two-tailed paired t-test; significance in c, i and j was calculated using the “diffcyt-DA-GLMM” method as implemented in the “diffcyt” function in view of the subjects pairing; *P < 0.05, **P < 0.01, ****P < 0.0001. The full names of the 25 cell types in CyTOF see Supplementary Fig. 1.

