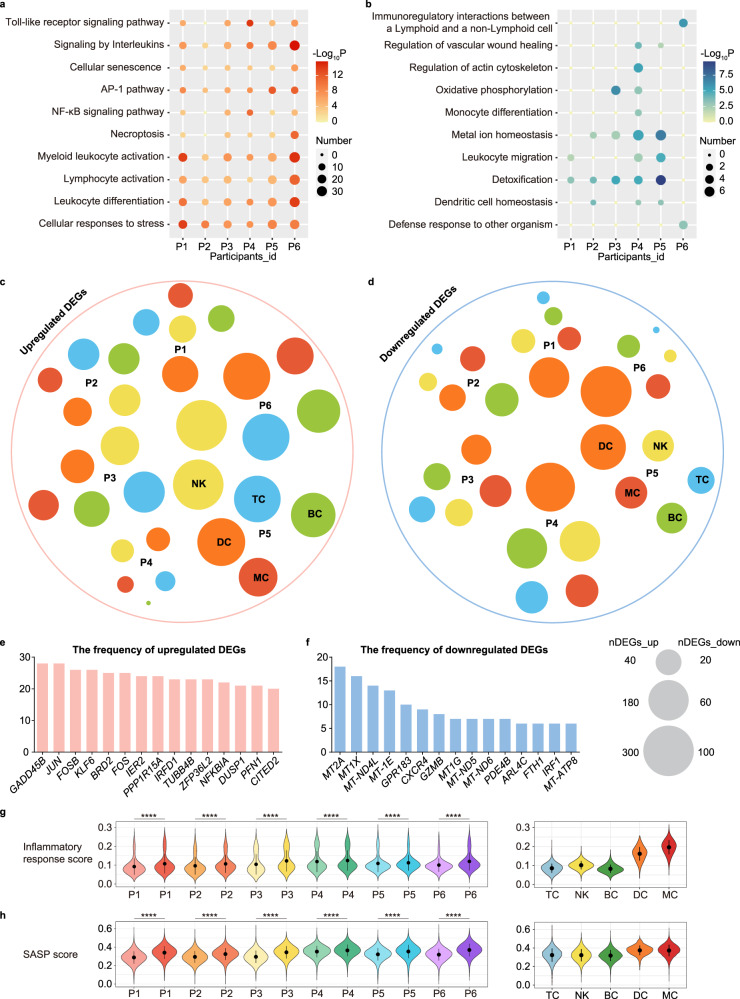
Fig. 2. Changes in transcriptional profiles among subjects.
Representative GO biological process and pathways enriched in upregulated (a) and downregulated (b) DEGs based on functional enrichment analysis among subjects. Dot plots showing the distribution of upregulated (c) and downregulated DEGs (d) in each major cell type of all six participants, the size indicates the numbers of DEGs, and the different colors annotate different cell type. Bar plots showing the frequencies of the top 15 upregulated (e) and downregulated (f) genes observed across all cell types in six participants. Violin plot of inflammatory response score (g) and SASP score (h) for each sample and immune cell lineage, different participants were represented in different colors, with darker colors representing after SU. For the box plot within each violin plot, middle lines indicate median values, boxes range from the 25th to 75th percentiles. Significance in g and h was calculated using two-sided Wilcoxon test as implemented in the function “compare_means” with default parameters; ****P < 0.0001.

