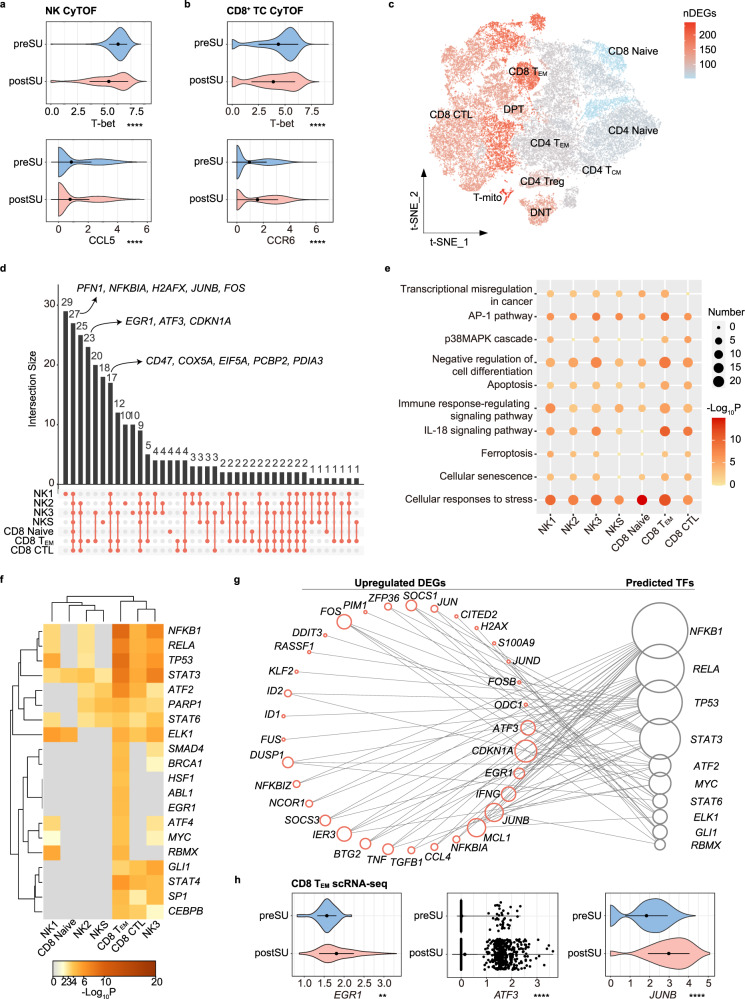
Fig. 4. Changes in proteomic and transcriptional profiles of cytotoxic cells.
a Violin plot showing the expression of T-bet and CCL5 in NK between preSU and postSU groups in CyTOF. b Violin plot showing the expression of T-bet and CCR6 in CD8+ TC between preSU and postSU groups in CyTOF. c Number of DEGs between preSU and postSU groups within each TC cluster projected onto the t-SNE map. d UpSet Plot showing the integrated comparative analysis of upregulated DEGs in cytotoxic cell subsets. e Representative GO biological process and pathways enriched in upregulated DEGs based on functional enrichment analysis in cytotoxic cell subsets. f The heatmap showing the enhanced activity of TFs predicted by TRRUST analysis in cytotoxic cell subsets. g Network visualization of the predicted transcriptional regulatory networks enhanced by SU using TRRUST tool. h Violin plot showing the expression of EGR1, ATF3, JUNB in CD8 TEM between preSU and postSU groups in scRNA-seq. For the box plot within each violin plot, middle lines indicate median values, boxes range from the 25th to 75th percentiles. Significance in a, b and h was calculated using two-sided Wilcoxon test as implemented in the function “compare_means” with default parameters; **P < 0.01, ****P < 0.0001.

