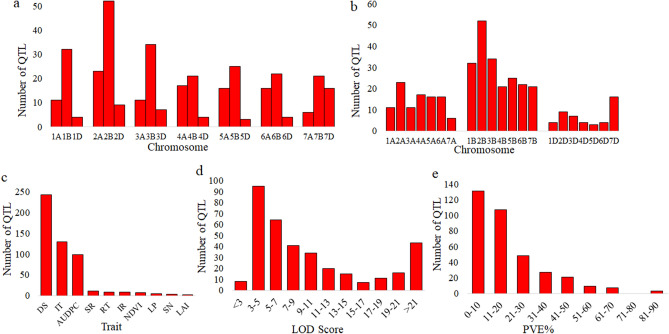
Figure 1.
QTLs for stripe rust resistance in wheat. Distribution of QTLs (a) on chromosomes of seven homoeologous groups, (b) on chromosomes of three sub-genomes, (c) for 10 different traits, (d) according to logarithm of odds (LOD) values, and (e) according to their phenotypic variation explained (PVE%). DS disease severity, IT infection type, AUDPC area under disease progress curve, SR stripe rust response, RT reaction type, IR infection response, NDVI normalized difference vegetation index, LP latency period, SN stripe number per 10 cm2 leaf area, LAI leaf area infected.

