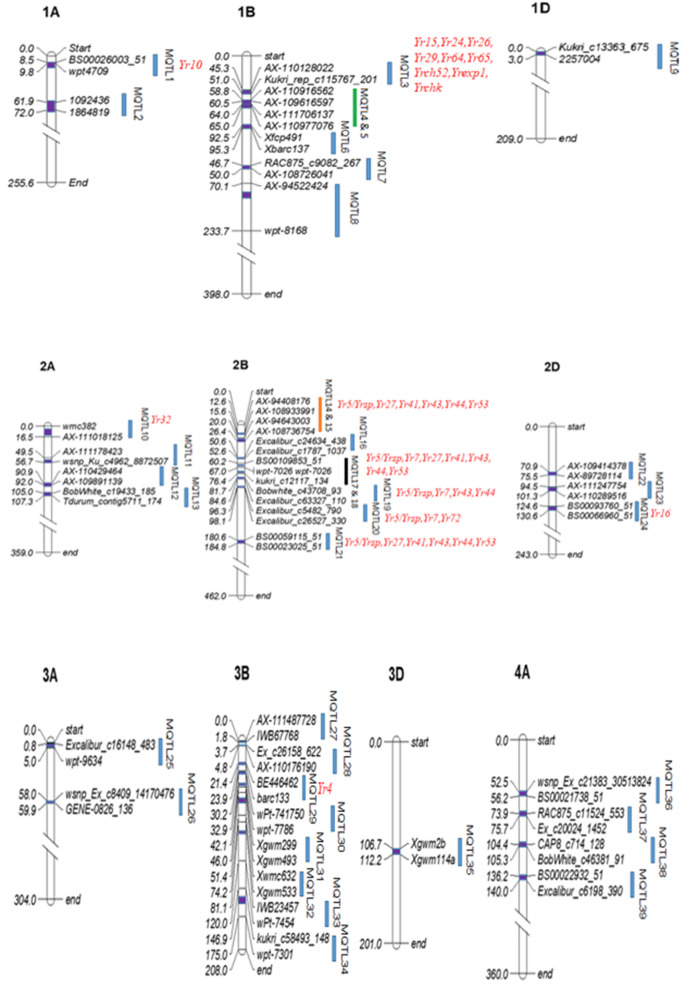
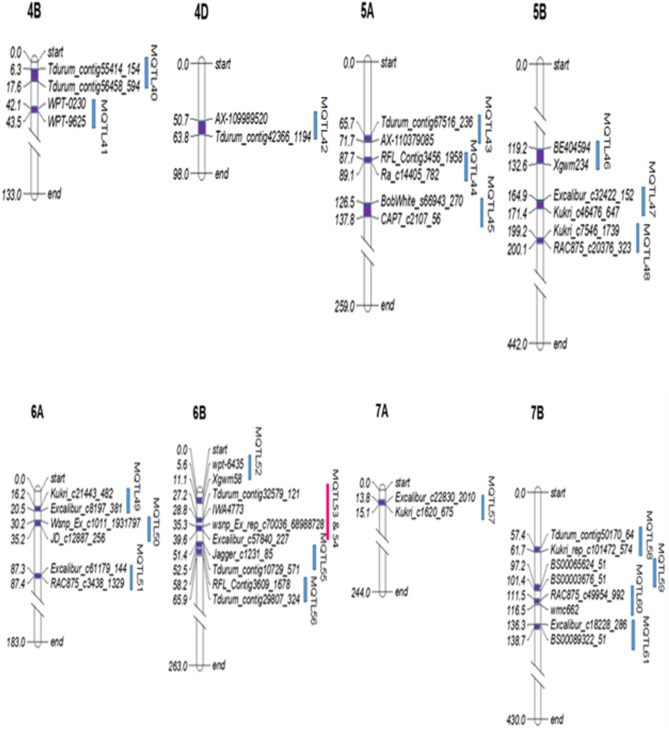
Figure 3.
Distribution of 61 MQTLs on 18 chromosomes of wheat. The dark blue rectangular blocks inside each chromosome indicate MQTL regions and the light blue vertical bars on the right of each chromosomes indicate marker intervals. Marker intervals, occupying closely linked pairs of QTL are shown by the green, orange, black and pink colors. Only the flanking markers most closely associated with MQTLs have been shown in the figure. The Yr genes located in the marker interval of the MQTLs are indicated in red font.


