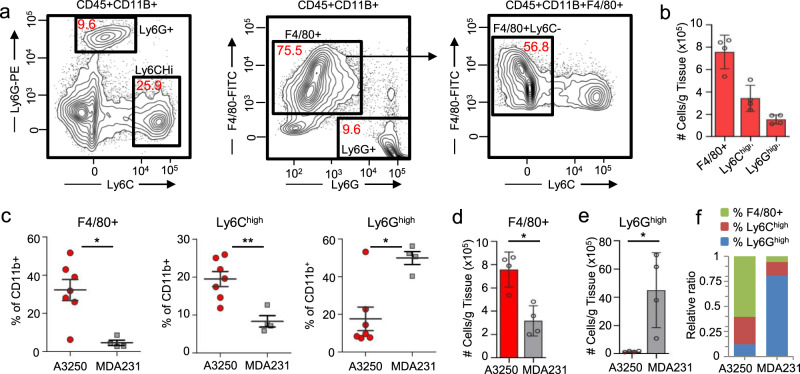
Fig. 5. Inflammation associated with A3250 tumors by FACS analysis.
a Gating strategy used to characterize myeloid cell populations in A3250 tumors. Numbers in red indicate percent of total CD45+ CD11b+ cells. b Quantification of different myeloid cell subsets in A3250 tumors at four weeks (n = 4). c Comparison of the frequency of myeloid cell subsets in A3250 (n = 7) and MDA-MB-231 (n = 4) tumors at 4 weeks as indicated. To control for repeated measures, a Linear Mixed Model fit by REML and t test using Satterthwaite’s method was used for analysis (%F4/80+: p = 0.015927, %Ly6Chigh: p = 0.00625, %Ly6Ghigh: p = 0.0205). Quantification of F4/80+ macrophages (d) and neutrophils (e) in A3250 (n = 4) and MDA-MB-231 (n = 4) tumors. Two-tailed Mann–Whitney t test yielded p = 0.0286 (d) and p = 0.029 (e). f Relative ratios of different myeloid cell populations in tumors as indicated. On the charts, mean ± SEM is indicated.**p < 0.01, *p < 0.05. Source data are provided as a Source Data file.

