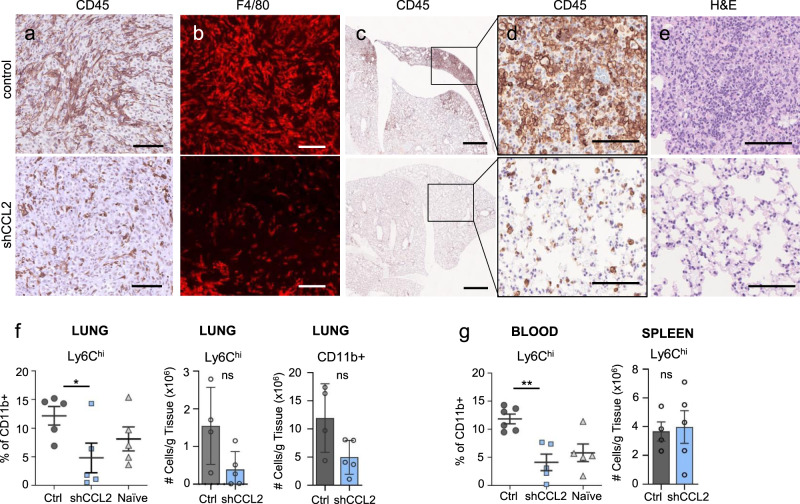
Fig. 9. Local and systemic effects of CCL2 knockdown in A3250 tumors.
Immunostaining of A3250-control and A3250-shCCL2 tumors for CD45 (a) and F4/80 (b) as indicated. c–e Lungs of mice bearing A3250-control or A3250-CCL2 tumors at 4 weeks post-injection (~40 mm3 volume), immuno-stained for CD45 (c, d) or stained for H&E (e). Flow cytometry analysis of CD11b+ and Ly6Chi cells in lungs (f), blood and spleen (g) from A3250 tumor-bearing (control), A3250-shCCL2 and naïve mice. f left panel, n = 5 biologically independent samples for each group, p = 0.0158; f middle and right panels, n = 4 A3250-control and n = 5 A3250-shCCL2 biologically independent lung samples. g left panel, n = 6 A3250-control and n = 5 for A3250-shCCL2 and tumor-naïve independent blood samples, p = 0.0011; (g) right panel, n = 4 A3250-control and n = 5 A3250-shCCL2 biologically independent spleen samples. Black lines on the plots indicate mean values ± SEM. (f–g), left panels: performed a two-sample t test to determine significance; (f), center and (f–g), right panels: significance was determined through a Mann–Whitney non-parametric t test. Images are representative of two independent experiments. n = 3 biologically independent mice. All scale bars: 100 μm, except (c), 1 mm. **p < 0.01, *p < 0.05; ns, not significant. Source data are provided as a Source Data file.

