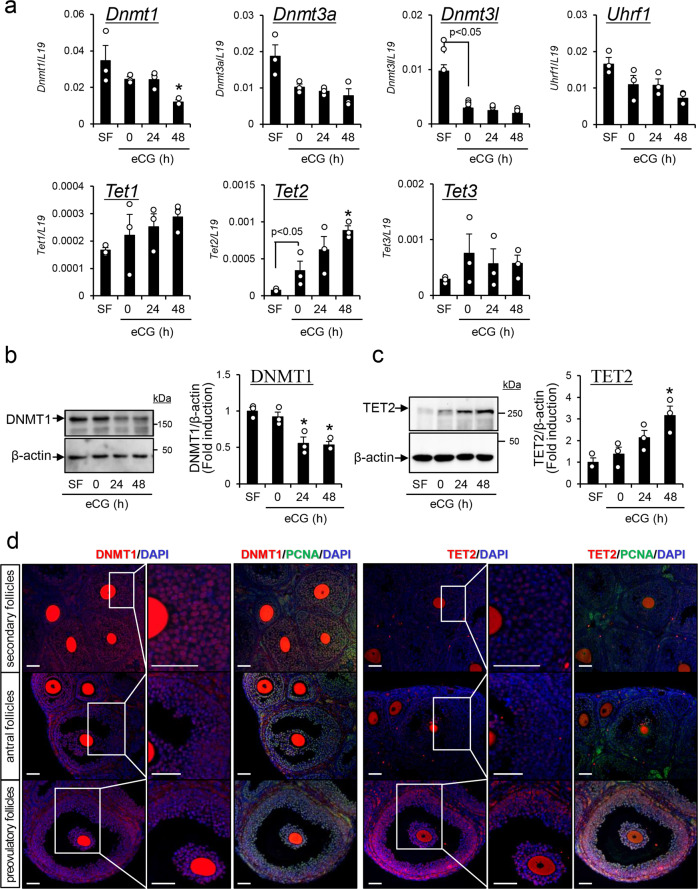
Fig. 1. Kinetic changes in the expression levels of genes involved in epigenetic regulatory mechanisms in mouse granulosa cells during follicular development.
a The expression levels of epigenetic-related genes in granulosa cells. Levels of mRNA were normalized to that of L19. Data represents the mean ± SEM (n = 3 biological replicates). Significant differences were observed between SF and eCG at 0 h (p < 0.05). *Significant differences were induced by eCG injection compared with before eCG injection (0 h) (p < 0.05). SF, secondary follicles. b, c Temporal changes of DNMT1 (b) and TET2 (c) in granulosa cells of secondary follicles (SF) with multilayered granulosa cells and antral follicles before or after eCG stimulation. β-Actin was used as a loading control. The results are representative of three independent experiments. Immunoblots shown are representative of three independent experiments. In each experiment, the different protein samples were used (n = 3 biological replicates). Quantitative expression of DNMT1 and TET2 relative to the expression of β-actin (control), as determined by western blotting. The SF value was set as 1 and the data are expressed as fold induction. The values are the mean ± SEM (n = 3 biological replicates). Significant differences were observed between SF and eCG at 0 h (p < 0.05). *Significant differences were induced by eCG injection compared with before eCG injection (0 h) (p < 0.05). Full-length blotting images of DNMT1, TET2, and β-actin are shown in Supplementary Fig. 8. d The localization of DNMT1, TET2, and PCNA in secondary follicles (SFs) and antral follicles (AFs) of 3-week-old immature mice or preovulatory follicles (PFs) of ovaries collected 48 h after eCG injection. DNMT1 and TET2 were visualized with Cy3, PCNA was visualized with FITC, and nuclei were stained with DAPI in the ovaries of 3-week-old mice treated with or without eCG. All of different length scale bars show 50 μm.

