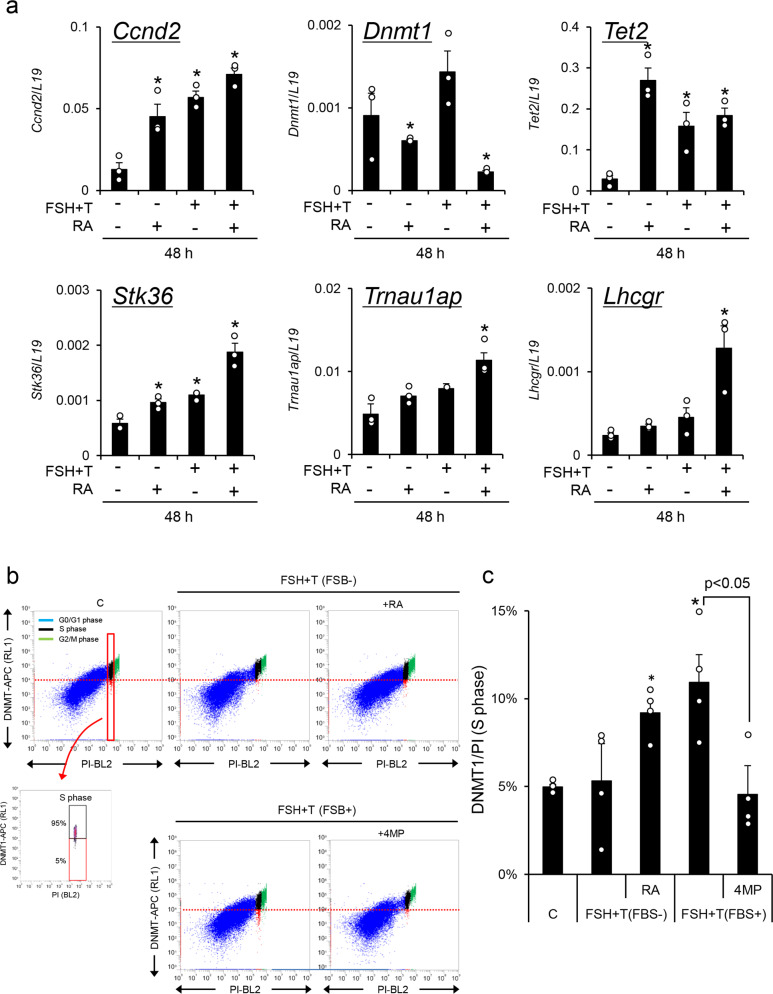
Fig. 7. The roles of retinoic acid (RA) in epigenetic regulation in granulosa cells during follicular development.
a The expression of Ccnd2, Dnmt1, Tet2, Lhcgr, Stk36, and Trnau1ap in cultured granulosa cells. Granulosa cells were collected from ovaries of 3-week-old mice after treatment with eCG for 6 h and were cultured in the absence of serum. FSH (100 ng/ml). T, testosterone (10 ng/ml). RA (1 μM). Levels of mRNA were normalized to that of L19. Values are represented as the mean ± SEM (n = 3 biological replicates). The value of the control (without any factors) was set as 1 and the data are presented as fold induction. *Significant differences were observed between the control group and the RA and/or FSH + T treatment group (p < 0.05). b, c The percentage of cells that expressed lower levels of DNMT1 was significantly increased by RA but decreased by the alcohol dehydrogenase (ADH) inhibitor (4MP). b The dot plot graph of double-positive granulosa cells with DNMT1 and PI during follicular development. c The percentage of cells that expressed lower levels of DNMT1 at S-phase. The lower threshold of DNMT1 levels at S-phase was set as 5% of cells with lower DNMT1 expression in the control group (C; without any factors) (red line). The cells that expressed lower levels of DNMT1 are shown in the red box, and cells with higher DNMT1 expression are shown in the black box at S-phase. Values are represented as the mean ± SEM (n = 4 biological replicates). *Significant differences were observed between the control group and the RA treatment group in the presence of FSH + T or the FSH + T treatment group in the presence of 1% FBS (p < 0.05). Significant differences were observed compared with those treated with no 4MP (p < 0.05). Significant differences in percentage values were transformed into normally distributed numbers by angle transformation and then analyzed by one-way ANOVA. Tukey–Kramer was used as post hoc test.

