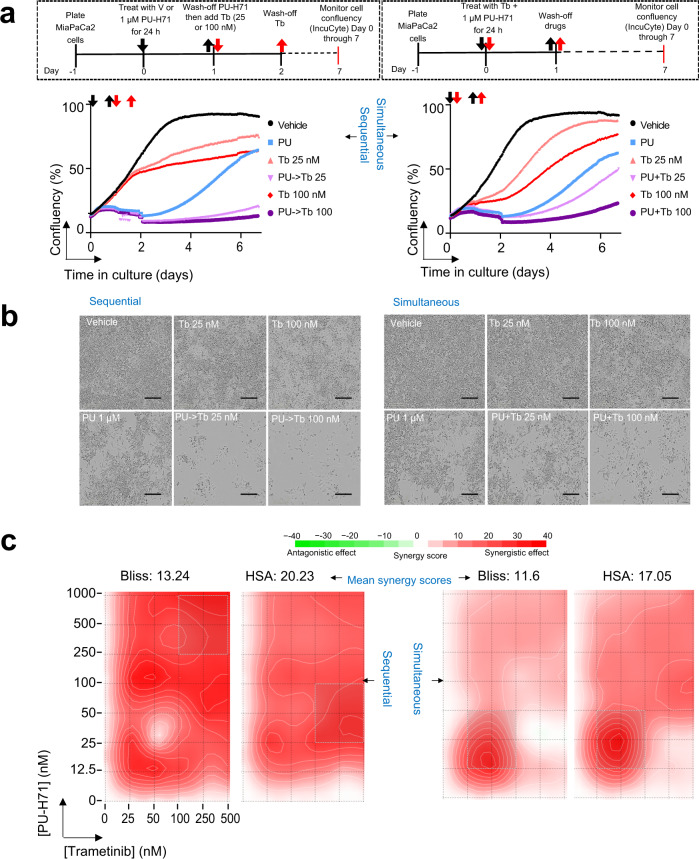
Fig. 7. Comparison of sequential and simultaneous drug addition paradigms.
a Cell confluency monitored by live-cell microscopy under the treatment paradigm as shown in schematics. PU, PU-H71 at 1 µM; Tb 25 and Tb 100, trametinib at 25 nM and 100 nM, respectively. Each curve represents the mean of three biological replicates from three and four independent experiments for simultaneous and sequential treatment, respectively. b Micrographs are representative of each experimental condition from (a). Images were taken at day 7. Scale bar, 300 µm. c Synergy analysis for the drug paradigms shown in panel (a). ATP levels were measured at day 3 as a surrogate of cell viability. Synergy scores were calculated using the SynergyFinder web-application using two synergy scoring models. Bliss independence principle is appropriate when two drugs are mutually nonexclusive, i.e. when each targets a different pathway. The highest Single Agent (HSA) states that the expected combination effect equals to the higher effect of individual drugs.

