Fig. 5.
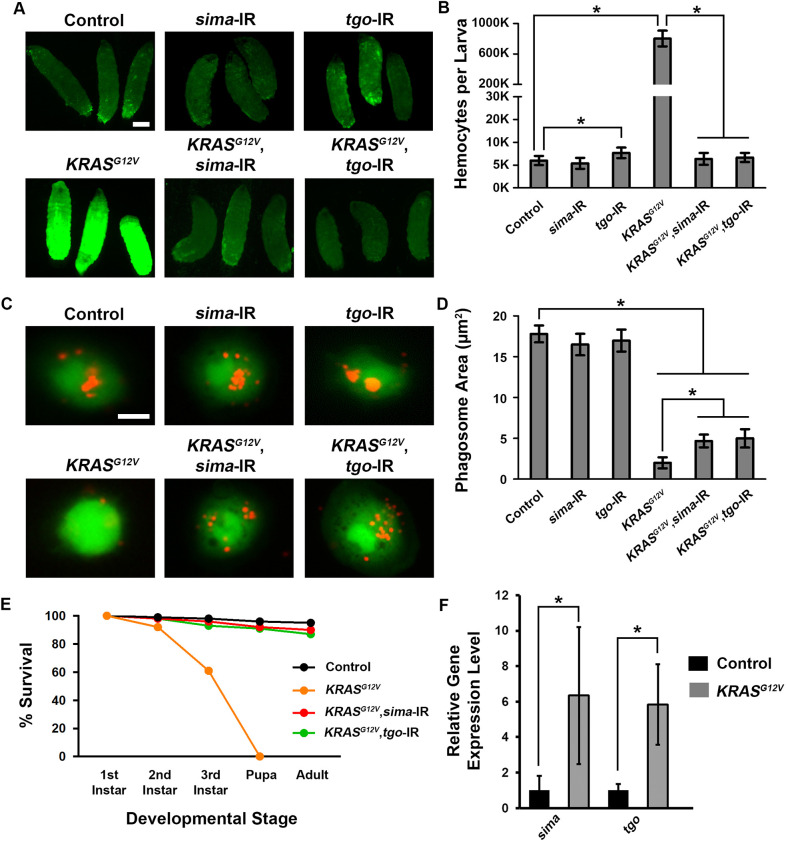
Silencing Drosophila HIF1 complex gene homologs sima and tgo rescues KRASG12V-induced hemocyte overproliferation, immune deficiency and pupal-stage developmental lethality. (A) Left upper and lower panels show control (Hml-Gal4, UAS-GFP) and KRASG12V (Hml-Gal4, UAS-GFP; UAS-KRASG12V) third-instar larvae, respectively, in which all hemocytes express GFP (green fluorescence). Middle and right panels illustrate the effects of silencing HIF1A homolog sima (sima-IR) and ARNT homolog tgo (tgo-IR), respectively, in control (upper) and KRASG12V (lower) third-instar larvae. Scale bar: 0.3 mm. (B) Quantification of total circulating hemocyte numbers with and without silencing of sima or tgo gene expression in control and KRASG12V third-instar larvae (n=6; results are presented as mean±s.d.; *P<0.05; Kruskal–Wallis H-test). (C) Left upper and lower panels show hemocytes (green) extracted from control and KRASG12V third-instar larvae, respectively, co-incubated with fluorescent Dextran-tagged S. aureus (red). Middle and right panels illustrate the effects of silencing HIF1A homolog sima (sima-IR) and ARNT homolog tgo (tgo-IR), respectively. Scale bar: 10 μm. (D) Quantification of phagosome area with and without silencing of sima or tgo gene expression in control and KRASG12V hemocytes (n=100; results are presented as mean±s.d.; *P<0.05; Kruskal–Wallis H-test). (E) Survival during development of control, KRASG12V and KRASG12V flies in which sima (sima-IR) or tgo (tgo-IR) were silenced in hemocytes. (F) Quantitative RT-PCR showing the relative expression level of sima and tgo in hemocytes from control compared to KRASG12V flies (n=3 replicates in each group; results are presented as mean±s.d.; *P<0.05; unpaired Student's t-test).

