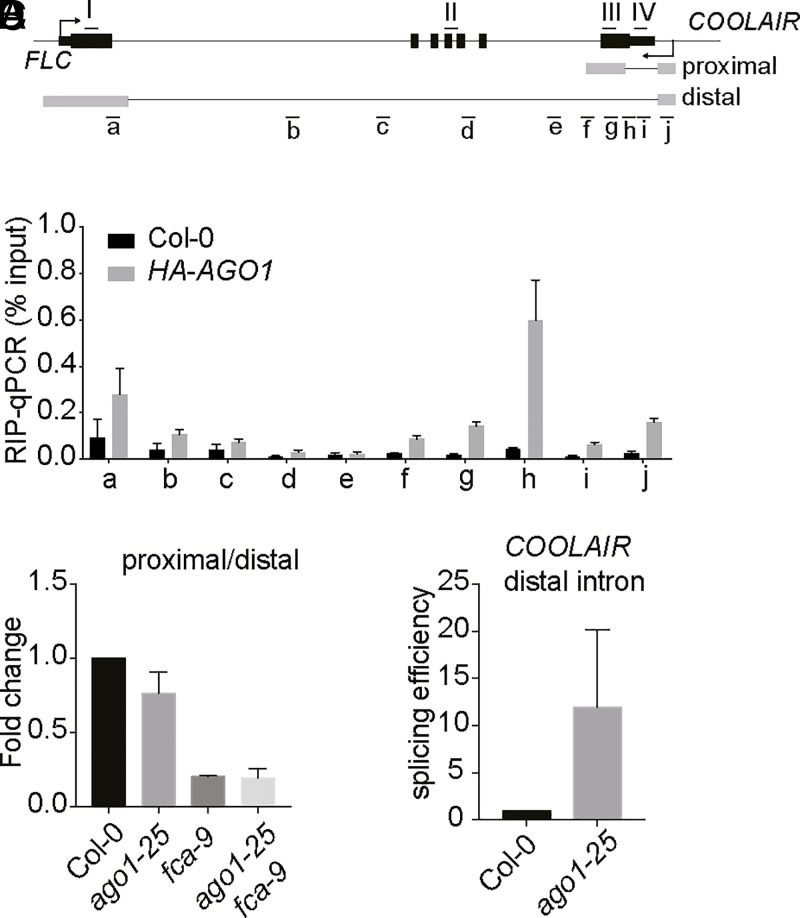
Fig. 2.
AGO1 associates with COOLAIR and influences COOLAIR processing. (A) Schematic diagram showing FLC gene structure and COOLAIR transcripts. Black and gray boxes represent FLC and COOLAIR exons, respectively. Black and gray lines represent FLC and COOLAIR introns, respectively. The arrow indicates the transcription start site (TSS). Short black lines with letters underneath indicate positions of amplicons in qPCR amplification. (B) RIP–qPCR analyzing HA-AGO1 enrichment on nascent COOLAIR transcript. Wild-type Col-0 was used as background control. The x axis corresponds to the fragments shown in A. Data are mean ± SD (n = 3). (C) The ratio of proximal-to-distal isoforms of COOLAIR transcripts (refer to the schematic in A) in various genotypes relative to Col-0. Data are mean ± SEM (n = 3). (D) The splicing efficiency of distal intron (spliced/unspliced) determined through chromatin-bound RNA analysis. Data are normalized to Col-0. Data are mean ± SD (n = 3).

