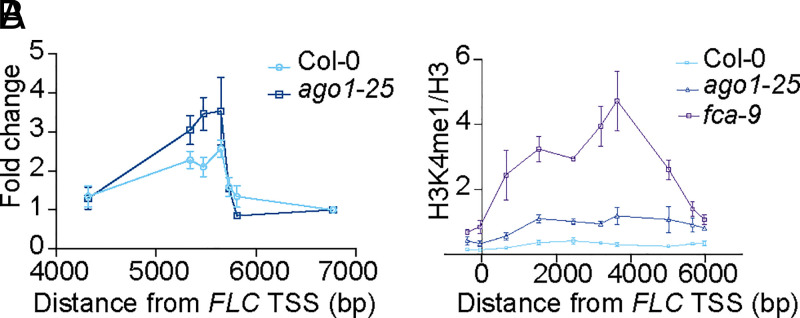
Fig. 3.
AGO1 promotes COOLAIR R-loop removal and FLC chromatic silencing. (A) DRIP–qPCR determining R-loop level in Col-0 and ago1-25. The number on the x axis is the distance to FLC TSS. Data are percentage of input normalized to a region without COOLAIR transcript (between 6,000 and 7,000 base pairs to FLC TSS). Data are presented as mean ± SEM (n = 3). (B) ChIP analysis of H3K4me1 level at FLC in various genotypes. The number on the x axis is the distance to FLC TSS. Data are mean ± SD (n = 3).

