Fig. 4.
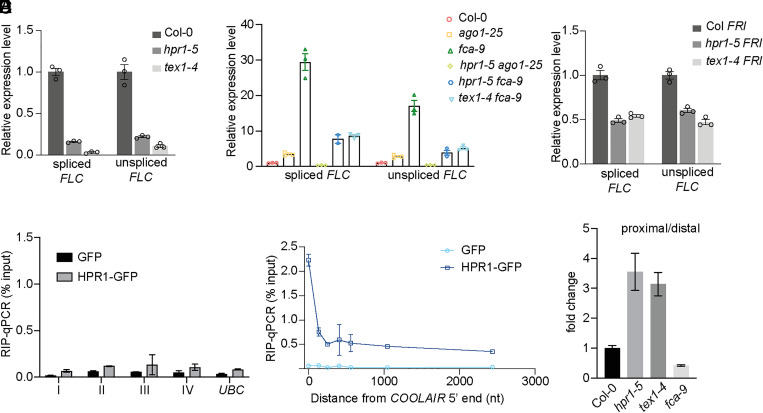
The THO/TREX complex up-regulates FLC and promotes distal COOLAIR. (A) Expression of spliced and unspliced FLC relative to UBC in various genotypes. Data are normalized to Col-0. Data are presented as the mean ± SEM (n = 3). (B) Expression of spliced and unspliced FLC relative to UBC in various genotypes. Data are normalized to Col-0. Data are presented as the mean ± SEM (n = 3). (C) Expression of spliced and unspliced FLC relative to UBC in various genotypes. Data are normalized to Col FRI. Data are presented as the mean ± SEM (n = 3). (D) RIP-qPCR analyzing HRP1-GFP enrichment on FLC mRNA in transgenic line expressing HPR1-GFP. Transgenic line expressing GFP alone was used as negative control. The x axis refers to the fragments shown in Fig. 2A. Data are mean ± SD (n = 3). (E) RIP-qPCR analyzing HRP1-GFP enrichment on nascent COOLAIR. Transgenic line expressing GFP was used as negative control. The x axis is the distance to COOLAIR 5′. Data are mean ± SD (n = 3). (F) The ratio of proximal-to-distal isoforms of COOLAIR transcripts (refer to the schematic in Fig. 2A) in various genotypes relative to Col-0. Data are mean ± SEM (n = 3).

