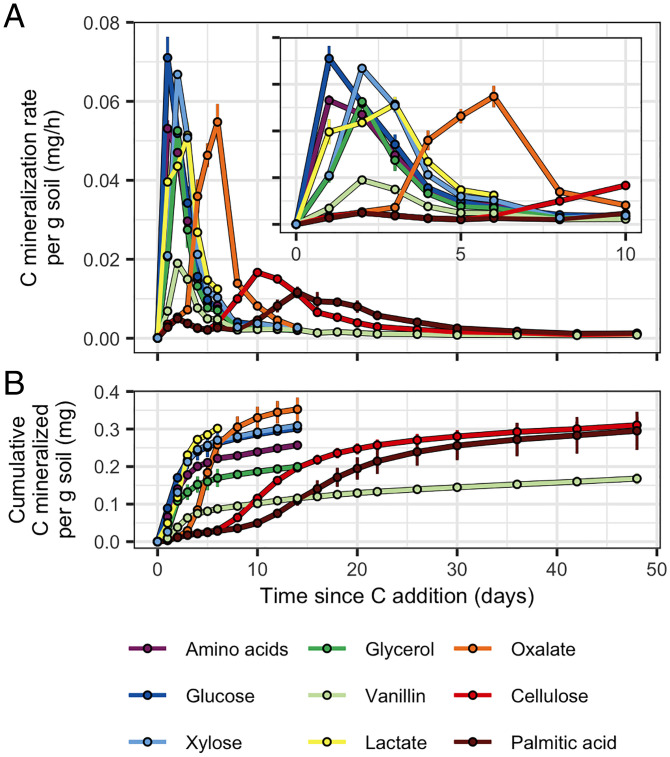
Fig. 2.
C source mineralization dynamics varied based on bioavailability. (A) 13C mineralization rates and (B) cumulative amounts of 13C mineralized per gram dry weight of soil. (A, Inset) A finer-scale representation of the 13C mineralization rates over days 0 to 10. Error bars represent ± SD among microcosm replicates (n = 3).

