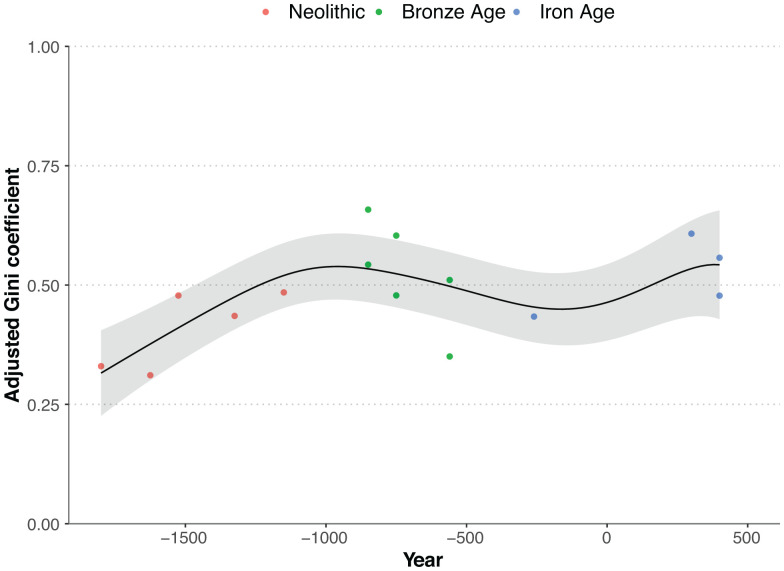
Fig. 2.
Adjusted GCs over time and time trend. The solid line shows the time trend estimated through a second-degree local polynomial regression with a kernel smoothing bandwidth parameter equal to 400 y. The light-gray area delimits the 95% CIs of the time trend. Dates are midpoints of the year intervals by phase-site shown in Table 1. Year “0” indicates beginning of AD/CE (Table 1).

