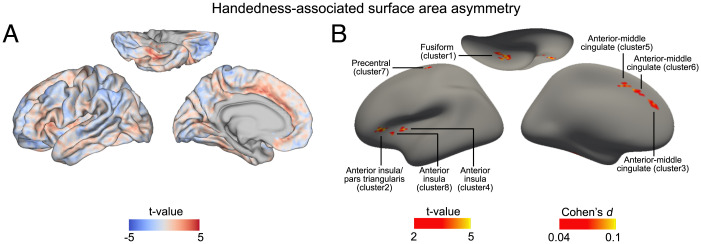
Fig. 1.
Handedness-associated cortical surface area asymmetries. (A) Group average differences of cortical surface area asymmetry between 28,802 right-handers and 3,062 left-handers shown for the whole cortex, without a threshold for significance. Red color indicates a lower asymmetry index in left-handers (weaker average leftward or stronger average rightward asymmetry in left-handers compared to right-handers). Blue indicates a higher asymmetry index in left-handers (stronger average leftward or weaker average rightward asymmetry in left-handers compared to right-handers). (B) Regional clusters with significant group average differences of surface area asymmetry between 28,802 right-handers and 3,062 left-handers. There were eight clusters that survived multiple testing correction (vertex-wise P < 0.001; cluster-wise P < 0.05). For all clusters, the effects were positive (weaker average leftward or stronger average rightward asymmetry in left-handers compared to right-handers). The clusters are shown on an inflated cortical surface model to visualize effects within folded regions. See also SI Appendix, Fig. S3, which shows the same maps against Brodmann regional atlas boundaries, for reference.

