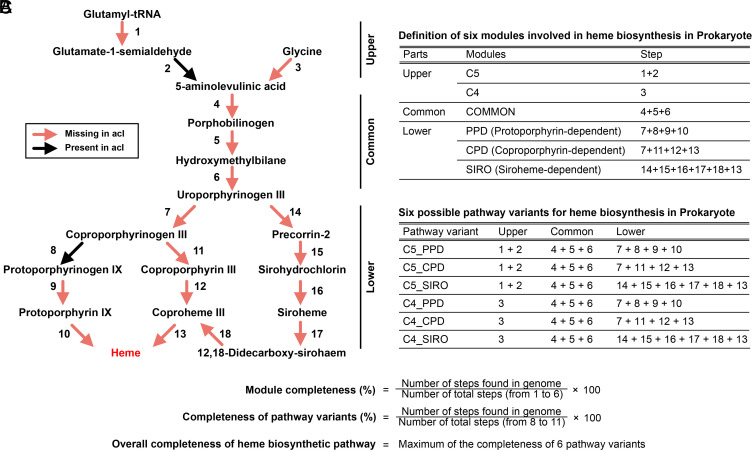
Fig. 1.
Overview of heme biosynthetic pathways in prokaryotes and the acI lineage. (A) Diagram showing the heme biosynthetic pathway steps. The presence (black) or absence (red) of each step in the 20 acI genomes are indicated by colored arrows. (B) Definition of modules and heme biosynthetic pathway variants used in this study. (C) Formulae for the calculation of completeness of modules and pathway variants. The maximum value among the completeness of six pathway variants of each genome was taken as the overall completeness of the genome. Refer to SI Appendix, Table S1 for a list of enzyme names and corresponding KO IDs of the steps defined in the diagram.

