Fig. 4.
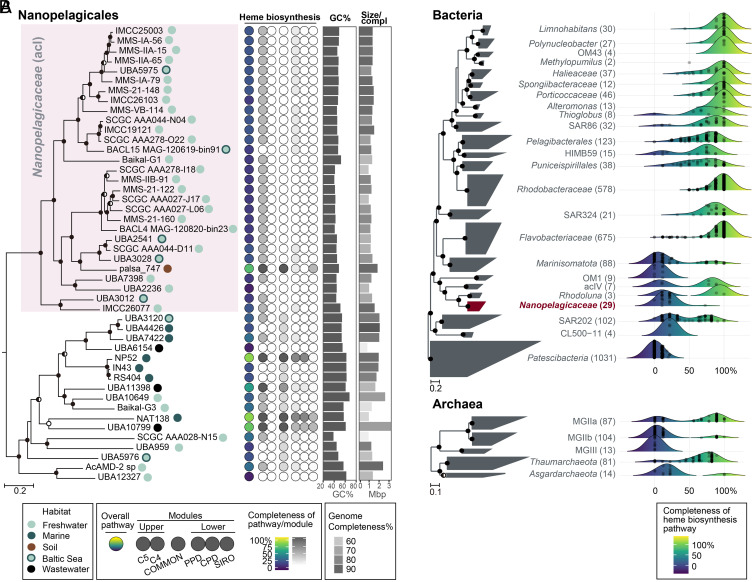
Heme biosynthetic pathway completeness of Nanopelagicales and major aquatic prokaryotic groups. (A) Heme biosynthetic pathway completeness of representative genomes for species clusters belonging to Nanopelagicales. A phylogenomic tree of Nanopelagicales constructed using a concatenated alignment of conserved marker proteins is shown on the left. The circles on the right side of genome names indicate isolation sources (habitats). The Nanopelagicaceae (acI) genomes are shaded in pink. Rhodoluna lacicola MWH-Ta8 (not shown here) was set as an outgroup. The middle column illustrates the overall (leftmost circle) and per-module (the remaining six circles) completeness of the heme biosynthetic pathway among the Nanopelagicales genomes. Refer to Fig. 1 for the heme biosynthetic pathway completeness calculations. The circle colors indicate the pathway completeness according to the color gradients in the bottom legend. The GC contents and genome sizes of the genomes are shown with bar graphs on the right. Genome completeness is indicated by the darkness of the genome size bars, as indicated by the scale at the bottom. (B) Distribution of the completeness of the heme biosynthetic pathway in major aquatic prokaryotic groups. Phylogenomic trees of representative genomes for species clusters affiliated with major aquatic bacterial and archaeal groups (SI Appendix, Table S4 and Dataset S1) are shown on the left. The number of genomes of the groups are indicated at the right of the group names (within parentheses). The Nanopelagicaceae family (acI lineage) is indicated in red. The phylum Patescibacteria and phyla Thaumarchaeota and Asgardarchaeota were set as the outgroups in the bacterial and archaeal trees, respectively. On the right, ridgeline density plots were used to illustrate the distribution of the completeness of heme biosynthetic pathways in the prokaryotic groups. The colors under the ridgelines indicate the completeness following a color gradient shown at the bottom. The points in the plots indicate the completeness of each genome of the groups. For the trees in this figure, bootstrap values (A; from 100 resamplings) and local support values (B; from 1,000 resamplings) are shown at the nodes as filled circles (≥90%), half-filled circles (≥70%), and empty circles (≥50%).

