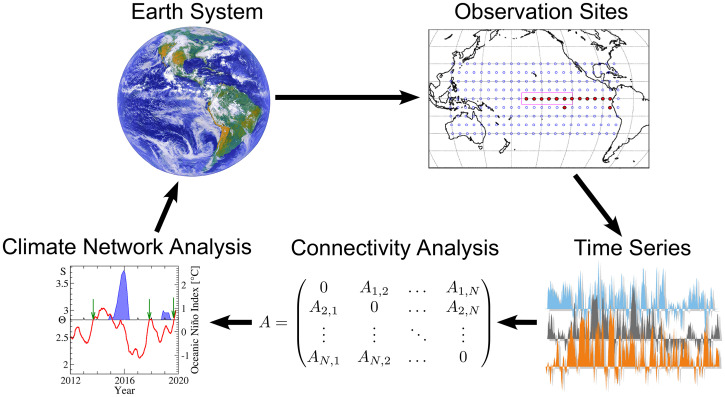
Fig. 1.
The climate network framework as a tool for prediction. Observational data of physical quantities, for example, temperatures, are available at different geographical locations. These data can be used directly or via a reanalysis (numerical weather model) which assimilates and maps them onto a regular grid. Thus, for each node (observational site or reanalysis grid point) of the climate network, a time series of the regarded physical quantity is available. Cooperativity between nodes can be detected from the similarity in the evolution of these time series and translated into links connecting the corresponding nodes. The links or their strengths may change with time. These nodes and their links constitute the evolving climate network, which can be represented by the adjacency (connectivity) matrix A. The analysis of this network can enable early predictions of climate phenomena and provide insights into the physical processes of the Earth system. For example, for forecasting El Niño, the nodes are in the Pacific, and the links are between the El Niño basin (full red circles) and the rest of the tropical Pacific (open blue circles). The rising of the network’s mean link strength S (red curve) above a certain threshold Θ serves as a precursor (green arrows) for the start of an El Niño event (blue areas) in the subsequent calendar year (32). Observation sites and Climate network analysis images are reprinted with permission from ref. 32.

