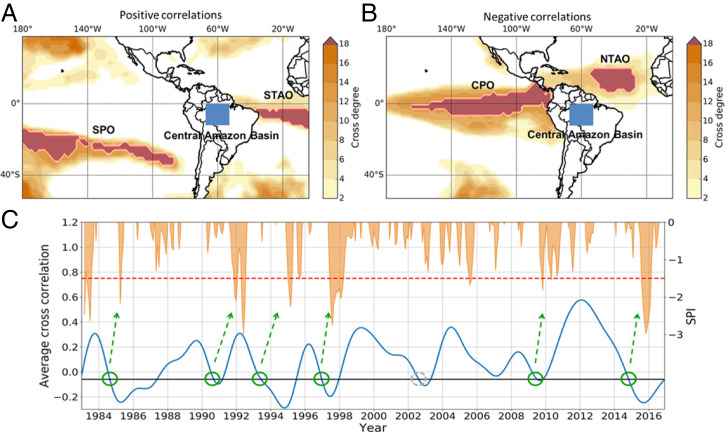
Fig. 3.
Drought prediction analysis based on correlation structure of SST anomalies in the northern and southern tropical Atlantic Ocean. (A and B) Cross degree between SSTs and continental rainfall anomalies. For each SST grid cell of the Atlantic and Pacific Ocean, the cross degree toward rainfall in the Central Amazon Basin (blue box) is shown, for (A) positive and (B) negative correlations. Darker shading indicates a larger cross degree, implying a larger number of links, and thus significant correlations with rainfall at more grid points in the Central Amazon Basin. Red areas outline coherent oceanic regions with the 20% highest cross degrees. Strong positive correlations are present between Central Amazon rainfall and the southern Pacific ocean (SPO) SSTs as well as southern tropical Atlantic ocean (STAO) SSTs. Strong negative correlations can be inferred, in contrast, for the central Pacific ocean (CPO) and the northern tropical Atlantic ocean (NTAO). (C) Early warning signal for droughts in the Central Amazon Basin. The time evolution of the average cross-correlation of the northern and southern tropical Atlantic Ocean (blue) is compared with the standardized precipitation index (SPI, orange) of the Central Amazon Basin. Negative SPI anomalies with SPI ¡ –1.5 (red dashed line) indicate severely dry periods. A drought event is predicted within the following one and a half years whenever the average cross-correlation between the SST anomalies falls below an empirically found threshold of -0.06. Green circles indicate a matching prediction, with one false alarm in 2002 indicated by a gray circle, where the threshold is crossed but no drought took place in the direct aftermath. The temporal evolution of the average cross-correlation shown here is smoothed using a Chebyshev type-I low-pass filter and cutoff at 24 mo. Reproduced with permission from ref. 39.

