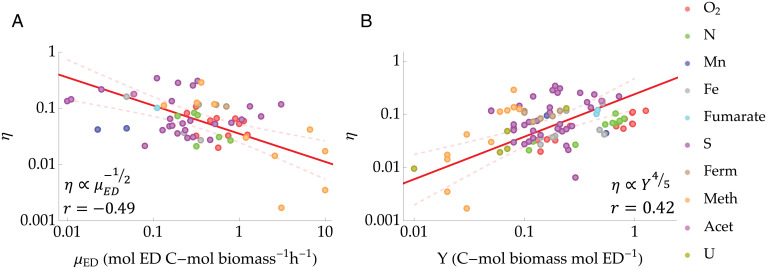
Fig. 2.
Thermodynamic efficiency across different metabolic pathways. (A) Power law relation between thermodynamic efficiency, η, and ED uptake rate, μED. (B) Power law relation between thermodynamic efficiency, η, and growth yield, Y. Red lines indicate the observed regression lines, while dashed light red lines indicate the 95% confidence bands. The data points are plotted using different colors depending on the specific electron accepting metabolic pathway (O2, N, Mn, Fe, fumarate, S, and U; fermentation [Ferm], methanogenic [Meth], and acetanogenic [Acet]). The power laws and the corresponding Pearson’s r values are shown. Table 2 shows a summary of the regressions.

