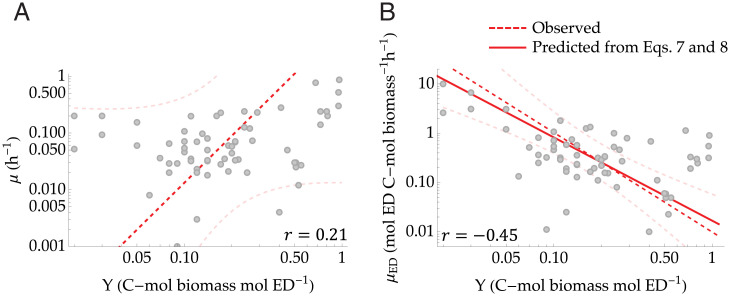
Fig. 4.
Relations between (A) growth rate, μ, and yield, Y, and (B) ED uptake rate, μED, and Y. B shows that there is a trade-off between the ED uptake rate and yield, which follows a power law relation. The solid red line indicates the prediction based on Eqs. 6. and 7, while dashed red lines indicate the observed regression (dark red) and confidence bands (light red). Gray points indicate the experimental values. The Pearson’s r values are given, and the regressions are summarized in Table 2.

