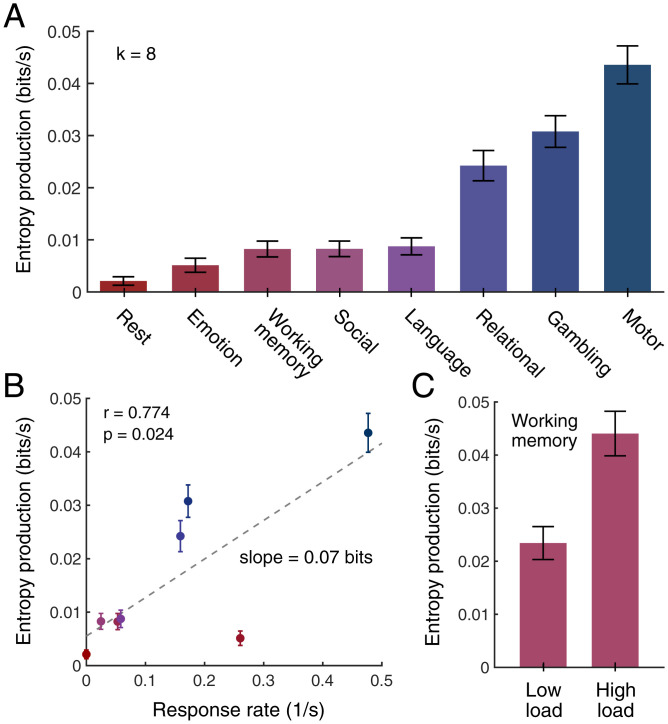
Fig. 4.
Entropy production in the brain varies with physical and cognitive demands. (A) Entropy production at rest and during seven cognitive tasks, estimated using hierarchical clustering with k = 8 clusters. (B) Entropy production as a function of response rate (i.e., the frequency with which subjects are asked to physically respond) for the tasks listed in A. Each response induces an average 0.07 ±0.03 bits of produced entropy (Pearson correlation r = 0.774, p = 0.024). (C) Entropy production for low cognitive load and high cognitive load conditions in the working memory task, where low and high loads represent 0-back and 2-back conditions, respectively, in an n-back task. The brain produces significantly more entropy during high-load than low-load conditions (one-sided t test, P < 0.001, t > 10, df = 198). In A–C, raw entropy productions (Eq. 1) are divided by the fMRI repetition time s to compute an entropy production rate, and error bars reflect 2-SD confidence intervals that arise due to finite data (Materials and Methods).

