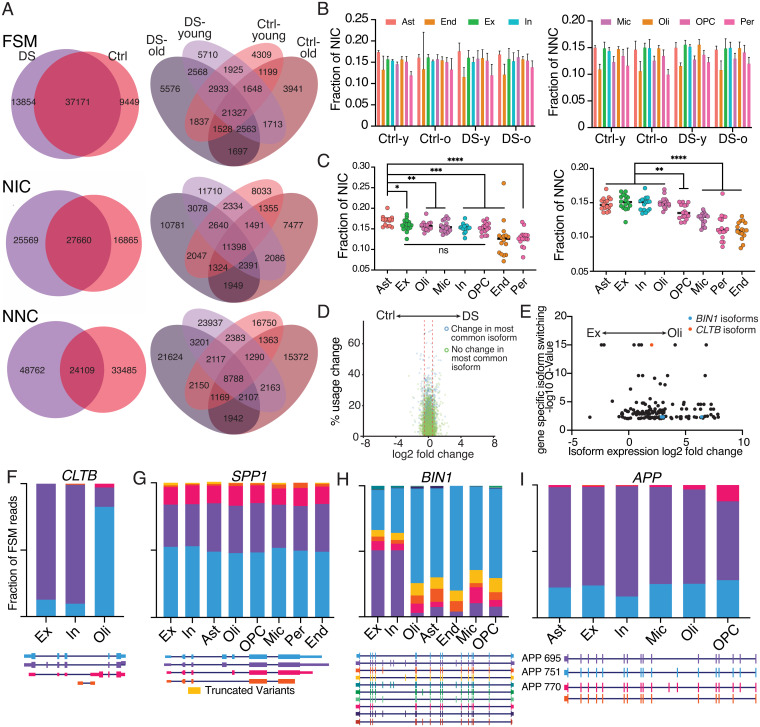
Fig. 5.
Novel isoform variants and specific isoform changes in different brain cell types. (A) Overlap of FSM, NIC, and NNC isoforms across DS, aging, and control (Ctrl) cohorts. (B) Fraction of total isoforms called as NIC or NNC by cohort and cell type. Two-way ANOVA, NIC by cohort P = 0.96, NIC by cell type P < 0.0001, NNC by cohort P = 0.13, NNC by cell type P < 0.0001. Error bars represent one SD. (C) Fraction of isoforms classified as NIC or NNC for each sample by cell type. Asterisks denote statistical significance in an unpaired t test (*P < 0.05, **P < 0.01, ***P < 0.001, ****P < 0.0001). (D) Volcano plot of isoform usage differences between DS and control cohorts. Percent usage change represents the redistribution of isoform proportions within a gene. Log2 fold-change is the change in expression of an isoform between two conditions. (E) Plot of significantly changed isoforms between excitatory and oligodendrocyte populations. Q-value represents the false-discovery rate for which at least one isoform of a particular gene displays differential proportionality across compared groups, signifying changes in isoform usage at the gene level. Only isoforms with <0.01 Q value and nonzero expression in both cell types are displayed. (F–I) Cell-type-specific isoform proportions for cell types with over 50 unique reads mapping to FSM isoforms for CLTB (F), SPP1 (G), BIN1 (H), and APP (I).

