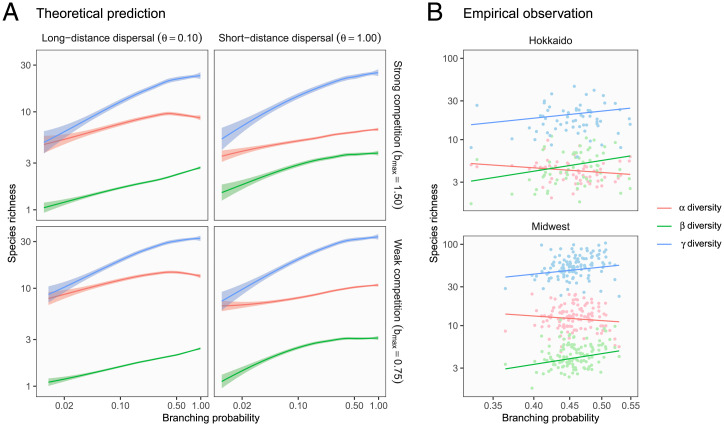
Fig. 3.
Qualitative match between theoretical predictions and empirical patterns in power law scaling of biodiversity. (A) Theoretical predictions. Ecosystem complexity (branching probability) scales diversity through increased or diversity across ecological scenarios. Lines and shades are loess curves fitted to simulated data and their 95% CIs. Each panel represents different ecological scenarios under which metacommunity dynamics were simulated. Refer to Fig. 2 for details. (B) Empirical observations. Observed biodiversity patterns match theoretical predictions of power law scaling along the axis of ecosystem complexity. Dots represent watershed replicates (i.e., metacommunities), and solid lines are predicted values from the robust regression models. The estimated slopes (i.e., the scaling exponents) were consistent across geographically distant regions with distinct fish fauna (Top: Hokkaido, Japan; Bottom: Midwest, United States).

