FIG. 3.
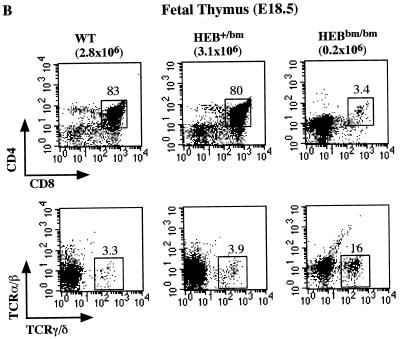
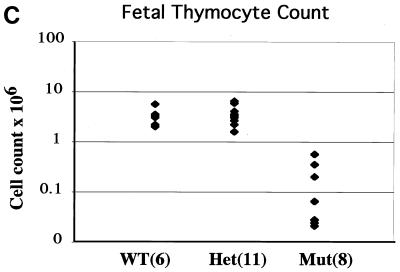
FACS analysis of B- and T-cell development in HEBbm mice. (A) Analysis of bone marrow (top) and lymph node (bottom) cells from adult HEBbm/+ and HEBbm/bm mice. CD43 and B220 markers were used to separate pro-B cells (CD43+ B220+), pre- and immature B cells (CD43low B220+), and mature B cells (CD43− B220high) in the bone marrow. TCRβ and B220 markers were used to separate T and B cells, respectively, in the lymph nodes. The relative percentage for each population is shown in the plots. Inguinal lymph nodes were collected from each animal, with the total cell numbers given on top of the plots. (B) E18.5 fetal thymus of wild-type, HEBbm/+, and HEBbm/bm thymocytes were analyzed in three separate stainings for CD4 and CD8 (top) and TCRα/β and TCRγ/δ (bottom) markers. CD4-, CD8-, and TCR-positive cells were gated out in the bottom panel. Cell counts of total thymocytes and individual populations are shown in the plots. Data are representative of multiple tests (n = 7 for HEBbm/bm). Events displayed for all plots in A and B are after size and 7AAD gating, which eliminates nonlymphoid and dead cells, respectively. (C) Cell count of E18.5 fetal thymus collected from five litters of timed mating between HEBbm heterozygous mice. Numbers of fetuses for each genotype included in the analysis are shown next to the genotype name in the chart. Means and standard deviations (in parentheses) for wild type, HEBbm/+, and HEBbm/bm are 3.3 (1.4) × 106, 3.6 (1.5) × 106, and 0.2 (0.2) × 106, respectively. Two-tailed t test shows a statistical difference between wild type and HEBbm/bm (P = 1.7 × 10⁻⁵) and no significant difference between wild type and HEBbm/+ (P = 0.7).


