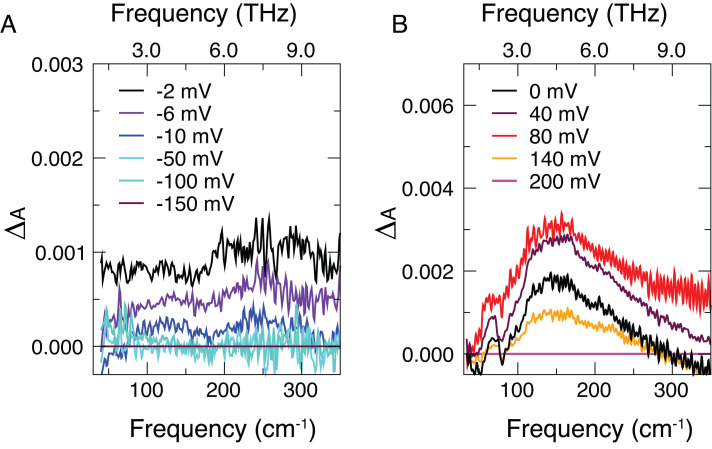
Fig. 1.
Absorption spectra as a function of the applied potential. (A) Spectra acquired during negative potential series for six selected bias voltages. Each spectrum, ΔA(ν; Vi), is referenced to the spectrum acquired at −150 mV. (B) Spectra acquired during positive potential series for five selected voltages. Each spectrum, ΔA(ν; Vi), is referenced to the spectrum acquired at +200 mV. The total set of spectra upon bias potential application is displayed in SI Appendix, Figs. S7 and S8. Following the curves from small voltage to large voltage shows changes in spectra as the EDL is formed by applied bias; note the nonmonotonic behavior for positive bias.

