Fig. 1.
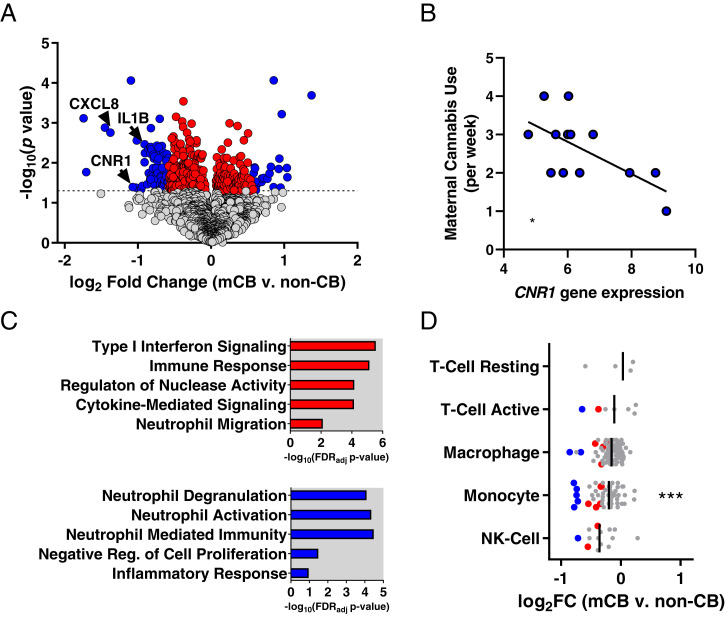
mCB is associated with reduced immune-related gene expression in placenta. (A) Volcano plot showing DEGs for mCB placentas (DEGs < 1.5-fold change [FC], red points; DEGs ≥ 1.5 FC, blue points). Note: 1.5 FC ∼0.58 log2 FC on x axis. (B) Significant inverse correlation between self-reported prenatal cannabis use and placental CNR1 gene expression (R = 0.64, P < 0.05). (C) Gene ontology analysis revealed that all DEGs (Top) and DEGs >1.5 FC (Bottom) were enriched for immune-related gene sets. (D) Log FCs (mCB vs. non-CB) for immune cell–type marker genes in placenta (mCB DEGs in red [<1.5 FC] or blue [≥1.5 FC] with bars depicting the median). NK-cell, natural killer cell. ***P < 0.001.

