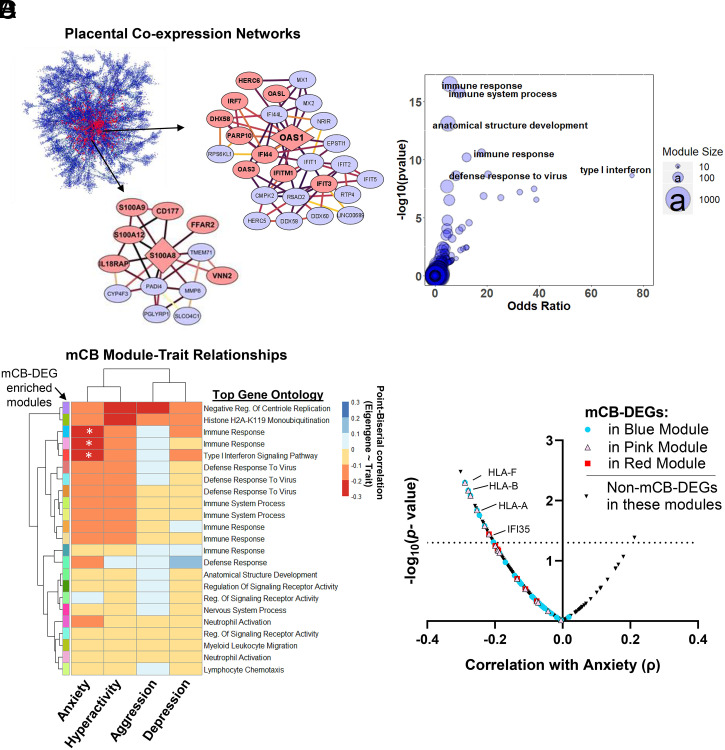
Fig. 2.
mCB is associated with placental gene coexpression networks related to immune function and heightened anxiety. (A) Multiscale embedded gene coexpression network composed of highly correlated gene modules. Arrows zoom in on two modules significantly enriched for mCB DEGs. Red nodes, DEGs; diamond shape, network hub genes. Darker edges between nodes represent stronger gene–gene correlations. (B) Bubble plot showing modules (blue circles) that are most significantly enriched for mCB DEGs are also enriched for immune-related gene ontology terms. (C) Heatmap of correlation coefficients between module eigengenes and child behavioral problems. Rows feature all modules enriched for mCB DEGs annotated with a unique color and top gene ontology term. *P < 0.05. (D) For each mCB DEG in the teal, pink, and red (C) modules correlated with anxiety, correlation coefficients with anxiety (x axis) and the −log10-transformed P values (y axis) are depicted. The dotted line represents the significance threshold for gene–anxiety correlations.

