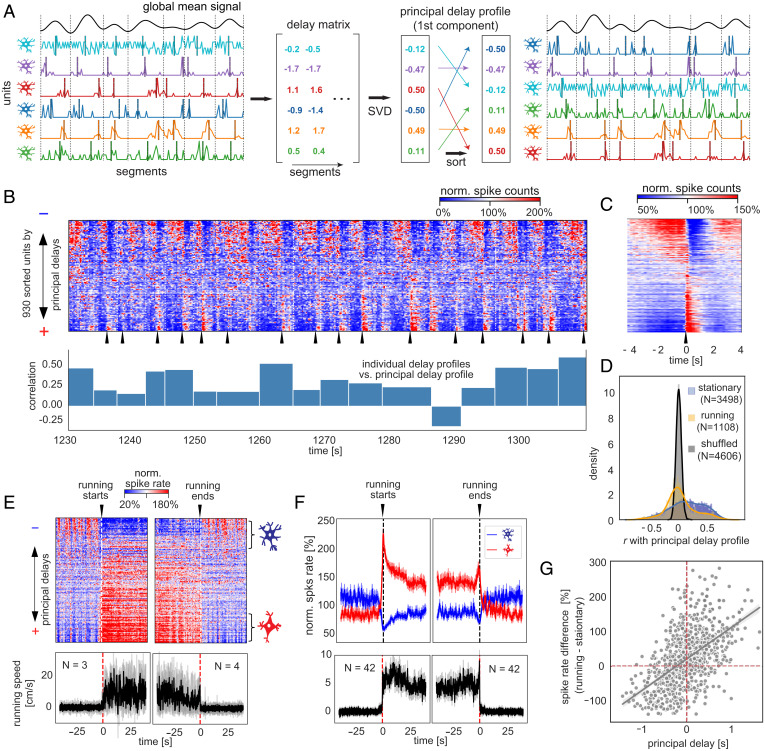
Fig. 2.
Sequential activations between two distinct neuronal ensembles define the resting-state neuronal dynamics. (A) Illustration of the delay-profile decomposition method to identify and extract sequential activation patterns in neuronal spiking data. The spiking data were divided into segments according to troughs of the filtered (<0.5 Hz) global mean signal. A delay profile was computed for each segment based on the centroid of spiking activity and then assembled to a delay matrix. The singular value decomposition (SVD) was applied to the delay matrix to extract the principal delay profile (i.e., the first principal component) that represents the major direction of sequential activations across neurons. Sorting neurons according to this principal delay profile allows us to visualize sequential activations of neurons. (B) An 80-s example of spontaneous spiking activity of the representative mouse with all 930 neurons sorted according to the principal delay profile (Top). The spiking counts of each neuron were normalized to percentage changes with respect to their temporal mean. The sharp activations of the positive-delay neurons were marked by black arrows. The bar plot (Bottom) shows the correlations between the principal delay profile and the delay profile of individual time segments, whose boundaries were marked by white dashed lines. (C) The mean pattern of sequential activation of the representative mouse was obtained by aligning and averaging the time segments of sequential activation according to the sharp activations of the positive-delay neurons. (D) Distributions of the correlations of individual delay profiles with the principal delay profile. They were summarized for the stationary (blue) and running (orange) periods, as well as the randomly shuffled (black) individual delay profiles. (E) Spiking activity (Top) and running speed (Bottom) at the transitions of running and stationary states for the representative mouse. The black and gray lines represent the mean and individual traces, respectively. (F) Spiking activity of the negative- and positive-delay neurons (Top) and running speed (Bottom) at the transitions of running and stationary states were summarized across all 14 mice. The thick lines represent the mean, whereas shadow regions denote areas within 1 SEM. (G) The principal delay value of individual neurons of the representative mouse is significantly correlated (r = 0.54, P = 2.5 × 10−71) with their spiking rate change across the running and stationary states.

