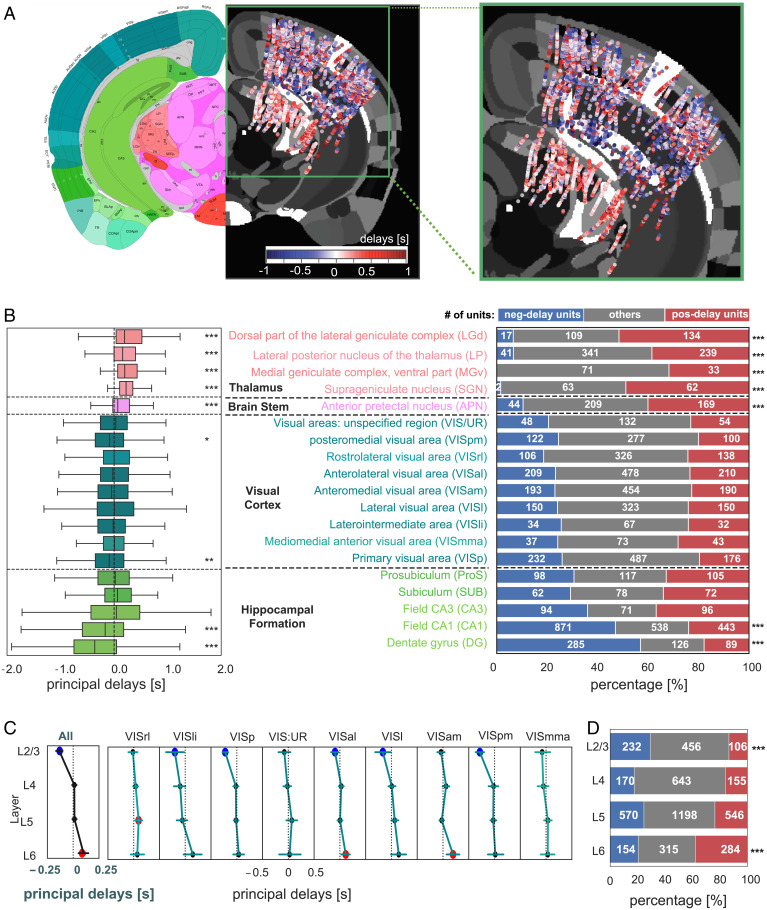
Fig. 3.
Spatial organization of the negative- and positive-delay neurons. (A) A map of the principal delay values. The principal delay values were averaged across units detected by the same channel, combined across all 14 animals, collapsed along the anterior-posterior direction, presented on an axial brain slice in the middle of recording sites, and shown along with a corresponding mouse brain atlas (Left; image credit: Allen Institute). The recording areas were amplified and shown on the Right. (B) A boxplot showing the region-specific distributions of the principal delay values (Left) is displayed together with a bar plot showing the percentages of three groups of neurons with distinct delays (Right). (C) The distributions of the principal delays across different cortical layers at various visual regions (pooled results in the first column). Error bars indicate 95% CIs of the mean delay. Brain regions with a mean delay significantly (P < 0.05) different from 0 are marked by colored circles (blue: negative; red: positive). (D) The percentages of the three types of neurons at different cortical layers. Asterisks represent the significance level (Bonferroni corrected: *0.01 < P < 0.05; **0.001 < P < 0.01; ***P < 0.001).

